VYNDAQEL® OR VYNDAMAX™ Clinical Studies
(tafamidis meglumine or tafamidis)
14. CLINICAL STUDIES
Efficacy was demonstrated in a multicenter, international, randomized, double-blind, placebo-controlled study in 441 patients with wild-type or hereditary ATTR-CM (NCT01994889).
Patients were randomized in a 1:2:2 ratio to receive VYNDAQEL 20 mg (n=88), VYNDAQEL 80 mg (administered as four 20-mg VYNDAQEL capsules) (n=176), or matching placebo (n=177) once daily for 30 months, in addition to standard of care (e.g., diuretics). Treatment assignment was stratified by the presence or absence of a variant TTR genotype as well as baseline disease severity (NYHA Class). Transplant patients were excluded from this study. Table 1 describes the patient demographics and baseline characteristics.
| Characteristic | Pooled Tafamidis N=264 | Placebo N=177 |
|---|---|---|
| Abbreviations: ATTRm = variant transthyretin amyloid, ATTRwt = wild-type transthyretin amyloid | ||
Age — years | ||
Mean (standard deviation) | 74.5 (7.2) | 74.1 (6.7) |
Median (minimum, maximum) | 75 (46, 88) | 74 (51, 89) |
Sex — number (%) | ||
Male | 241 (91.3) | 157 (88.7) |
Female | 23 (8.7) | 20 (11.3) |
TTR Genotype — number (%) | ||
ATTRm | 63 (23.9) | 43 (24.3) |
ATTRwt | 201 (76.1) | 134 (75.7) |
NYHA Class — number (%) | ||
NYHA Class I | 24 (9.1) | 13 (7.3) |
NYHA Class II | 162 (61.4) | 101 (57.1) |
NYHA Class III | 78 (29.5) | 63 (35.6) |
The primary analysis used a hierarchical combination applying the method of Finkelstein-Schoenfeld (F-S) to all-cause mortality and frequency of cardiovascular-related hospitalizations, which was defined as the number of times a subject was hospitalized (i.e., admitted to a hospital) for cardiovascular-related morbidity. The method compared each patient to every other patient within each stratum in a pair-wise manner that proceeded in a hierarchical fashion using all-cause mortality followed by frequency of cardiovascular-related hospitalizations when patients could not be differentiated based on mortality.
This analysis demonstrated a significant reduction (p=0.0006) in all-cause mortality and frequency of cardiovascular-related hospitalizations in the pooled VYNDAQEL 20-mg and 80-mg groups versus placebo (Table 2).
| Primary Analysis | Pooled VYNDAQEL N=264 | Placebo N=177 |
|---|---|---|
| ||
Number (%) of Subjects Alive* at Month 30 | 186 (70.5) | 101 (57.1) |
Mean Number of Cardiovascular-related Hospitalizations During 30 months (per patient per year) Among Those Alive at Month 30 | 0.297 | 0.455 |
p-value from F-S Method | 0.0006 | |
Analysis of the individual components of the primary analysis (all-cause mortality and cardiovascular-related hospitalization) also demonstrated significant reductions for VYNDAQEL versus placebo.
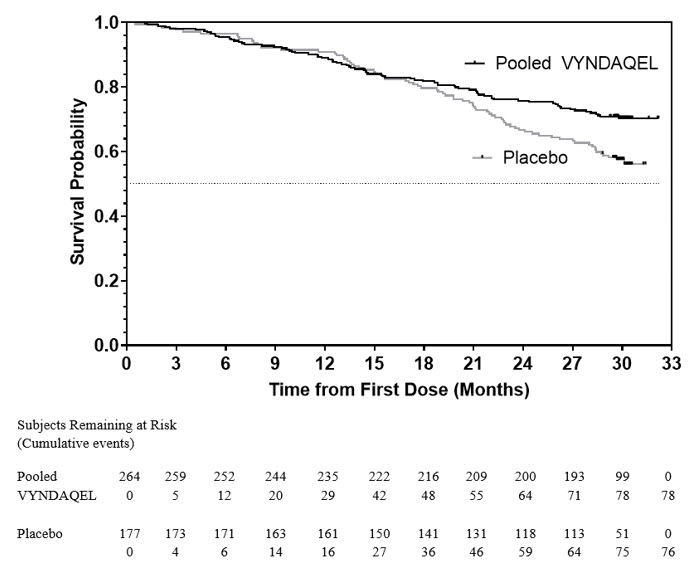
The hazard ratio from the all-cause mortality Cox-proportional hazard model for pooled VYNDAQEL versus placebo was 0.70 (95% confidence interval [CI] 0.51, 0.96), indicating a 30% relative reduction in the risk of death relative to the placebo group (p=0.026). Approximately 80% of total deaths were cardiovascular-related in both treatment groups. A Kaplan-Meier plot of time to event all-cause mortality is presented in Figure 1.
|
Figure 1: All-Cause Mortality* |
 |
There were significantly fewer cardiovascular-related hospitalizations with VYNDAQEL compared with placebo with a reduction in risk of 32% corresponding to a Relative Risk Ratio of 0.68 (Table 3).
| Pooled VYNDAQEL N=264 | Placebo N=177 | |
|---|---|---|
| ||
Total (%) Number of Subjects with Cardiovascular-related Hospitalizations | 138 (52.3) | 107 (60.5) |
Cardiovascular-related Hospitalizations per Year* | 0.48 | 0.70 |
Pooled VYNDAQEL vs Placebo Treatment Difference (Relative Risk Ratio)* | 0.68 | |
p-value* | <0.0001 | |
The treatment effects of VYNDAQEL on functional capacity and health status were assessed by the 6-Minute Walk Test (6MWT) and the Kansas City Cardiomyopathy Questionnaire-Overall Summary (KCCQ-OS) score, respectively. A significant treatment effect favoring VYNDAQEL was first observed at Month 6 and remained consistent through Month 30 on both 6MWT distance and KCCQ-OS score (Figure 2 and Table 4).
Figure 2: Change from Baseline to Month 30 in 6MWT Distance and KCCQ-OS Score
 |
Abbreviations: 6MWT=6-Minute Walk Test, KCCQ-OS=Kansas City Cardiomyopathy Questionnaire-Overall Summary.
Panel A shows change from Baseline to Month 30 in pooled VYNDAQEL patients compared with placebo patients in 6MWT distance.
Panel B shows change from Baseline to Month 30 in pooled VYNDAQEL patients compared with placebo patients in KCCQ-OS score.
The Kansas City Cardiomyopathy Questionnaire-Overall Summary (KCCQ-OS) score is composed of four domains including Total Symptoms (Symptom Frequency and Symptom Burden), Physical Limitation, Quality of Life, and Social Limitation. The Overall Summary score and domain scores range from 0 to 100, with higher scores representing better health status. All four domains favored pooled VYNDAQEL compared to placebo at Month 30, and demonstrated similar treatment effects to the KCCQ-OS score (Figure 2 and Table 4). The distribution for change from Baseline to Month 30 for KCCQ-OS (Figure 3) shows that the proportion of patients with worse KCCQ-OS scores was lower for the pooled VYNDAQEL-treated group compared to placebo, and the proportion with improved scores was higher (Figure 3).
Figure 3: Histogram of Change from Baseline to Month 30 in KCCQ-Overall Summary Score
 |
Abbreviation: KCCQ-OS=Kansas City Cardiomyopathy Questionnaire-Overall Summary.
| Abbreviations: 6MWT = 6-Minute Walk Test; KCCQ-OS = Kansas City Cardiomyopathy Questionnaire-Overall Summary; SD = standard deviation; LS = least squares; SE = standard error; CI = confidence interval | |||||
Endpoints | Baseline Mean (SD) | Change from Baseline to Month 30, LS Mean (SE) | Treatment Difference from Placebo | ||
Pooled VYNDAQEL | Placebo | Pooled VYNDAQEL | Placebo | ||
6MWT | 351 | 353 | -55 | -131 | 76 |
KCCQ-OS | 67 | 66 | -7 | -21 | 14 |
Results from the F-S method represented by win ratio for the combined endpoint and its components (all-cause mortality and frequency of CV-related hospitalization) consistently favored VYNDAQEL versus placebo across all subgroups (wild-type, variant and NYHA Class I & II, and III), except for CV-related hospitalization frequency in NYHA Class III (Figure 4). Win ratio is the number of pairs of VYNDAQEL-treated patient "wins" divided by number of pairs of placebo patient "wins." Analyses of 6MWT and KCCQ-OS also favored VYNDAQEL relative to placebo within each subgroup.
Figure 4: Results by Subgroup, Dose, and Components of Primary Analysis
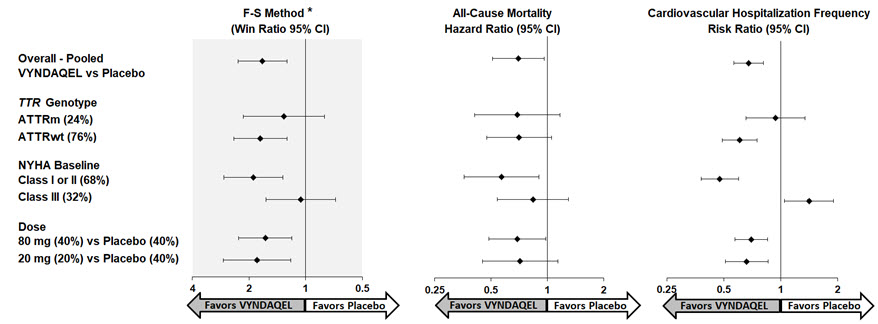
Abbreviations: ATTRm = variant transthyretin amyloid, ATTRwt = wild-type transthyretin amyloid, F-S = Finkelstein Schoenfeld, CI = Confidence Interval
*F-S results presented using win ratio (based on all-cause mortality and frequency of cardiovascular hospitalization)
Heart transplants and cardiac mechanical assist devices treated as death.
Results of the primary analysis, 6MWT at Month 30 and KCCQ-OS at Month 30 were statistically significant for both the 80-mg and 20-mg doses of VYNDAQEL vs. placebo, with similar results for both doses.
Find VYNDAQEL® OR VYNDAMAX™ medical information:
Find VYNDAQEL® OR VYNDAMAX™ medical information:
VYNDAQEL® OR VYNDAMAX™ Quick Finder
Health Professional Information
Clinical Studies
14. CLINICAL STUDIES
Efficacy was demonstrated in a multicenter, international, randomized, double-blind, placebo-controlled study in 441 patients with wild-type or hereditary ATTR-CM (NCT01994889).
Patients were randomized in a 1:2:2 ratio to receive VYNDAQEL 20 mg (n=88), VYNDAQEL 80 mg (administered as four 20-mg VYNDAQEL capsules) (n=176), or matching placebo (n=177) once daily for 30 months, in addition to standard of care (e.g., diuretics). Treatment assignment was stratified by the presence or absence of a variant TTR genotype as well as baseline disease severity (NYHA Class). Transplant patients were excluded from this study. Table 1 describes the patient demographics and baseline characteristics.
| Characteristic | Pooled Tafamidis N=264 | Placebo N=177 |
|---|---|---|
| Abbreviations: ATTRm = variant transthyretin amyloid, ATTRwt = wild-type transthyretin amyloid | ||
Age — years | ||
Mean (standard deviation) | 74.5 (7.2) | 74.1 (6.7) |
Median (minimum, maximum) | 75 (46, 88) | 74 (51, 89) |
Sex — number (%) | ||
Male | 241 (91.3) | 157 (88.7) |
Female | 23 (8.7) | 20 (11.3) |
TTR Genotype — number (%) | ||
ATTRm | 63 (23.9) | 43 (24.3) |
ATTRwt | 201 (76.1) | 134 (75.7) |
NYHA Class — number (%) | ||
NYHA Class I | 24 (9.1) | 13 (7.3) |
NYHA Class II | 162 (61.4) | 101 (57.1) |
NYHA Class III | 78 (29.5) | 63 (35.6) |
The primary analysis used a hierarchical combination applying the method of Finkelstein-Schoenfeld (F-S) to all-cause mortality and frequency of cardiovascular-related hospitalizations, which was defined as the number of times a subject was hospitalized (i.e., admitted to a hospital) for cardiovascular-related morbidity. The method compared each patient to every other patient within each stratum in a pair-wise manner that proceeded in a hierarchical fashion using all-cause mortality followed by frequency of cardiovascular-related hospitalizations when patients could not be differentiated based on mortality.
This analysis demonstrated a significant reduction (p=0.0006) in all-cause mortality and frequency of cardiovascular-related hospitalizations in the pooled VYNDAQEL 20-mg and 80-mg groups versus placebo (Table 2).
| Primary Analysis | Pooled VYNDAQEL N=264 | Placebo N=177 |
|---|---|---|
| ||
Number (%) of Subjects Alive* at Month 30 | 186 (70.5) | 101 (57.1) |
Mean Number of Cardiovascular-related Hospitalizations During 30 months (per patient per year) Among Those Alive at Month 30 | 0.297 | 0.455 |
p-value from F-S Method | 0.0006 | |
Analysis of the individual components of the primary analysis (all-cause mortality and cardiovascular-related hospitalization) also demonstrated significant reductions for VYNDAQEL versus placebo.
The hazard ratio from the all-cause mortality Cox-proportional hazard model for pooled VYNDAQEL versus placebo was 0.70 (95% confidence interval [CI] 0.51, 0.96), indicating a 30% relative reduction in the risk of death relative to the placebo group (p=0.026). Approximately 80% of total deaths were cardiovascular-related in both treatment groups. A Kaplan-Meier plot of time to event all-cause mortality is presented in Figure 1.
|
Figure 1: All-Cause Mortality* |
|
There were significantly fewer cardiovascular-related hospitalizations with VYNDAQEL compared with placebo with a reduction in risk of 32% corresponding to a Relative Risk Ratio of 0.68 (Table 3).
| Pooled VYNDAQEL N=264 | Placebo N=177 | |
|---|---|---|
| ||
Total (%) Number of Subjects with Cardiovascular-related Hospitalizations | 138 (52.3) | 107 (60.5) |
Cardiovascular-related Hospitalizations per Year* | 0.48 | 0.70 |
Pooled VYNDAQEL vs Placebo Treatment Difference (Relative Risk Ratio)* | 0.68 | |
p-value* | <0.0001 | |
The treatment effects of VYNDAQEL on functional capacity and health status were assessed by the 6-Minute Walk Test (6MWT) and the Kansas City Cardiomyopathy Questionnaire-Overall Summary (KCCQ-OS) score, respectively. A significant treatment effect favoring VYNDAQEL was first observed at Month 6 and remained consistent through Month 30 on both 6MWT distance and KCCQ-OS score (Figure 2 and Table 4).
Figure 2: Change from Baseline to Month 30 in 6MWT Distance and KCCQ-OS Score
|
Abbreviations: 6MWT=6-Minute Walk Test, KCCQ-OS=Kansas City Cardiomyopathy Questionnaire-Overall Summary.
Panel A shows change from Baseline to Month 30 in pooled VYNDAQEL patients compared with placebo patients in 6MWT distance.
Panel B shows change from Baseline to Month 30 in pooled VYNDAQEL patients compared with placebo patients in KCCQ-OS score.
The Kansas City Cardiomyopathy Questionnaire-Overall Summary (KCCQ-OS) score is composed of four domains including Total Symptoms (Symptom Frequency and Symptom Burden), Physical Limitation, Quality of Life, and Social Limitation. The Overall Summary score and domain scores range from 0 to 100, with higher scores representing better health status. All four domains favored pooled VYNDAQEL compared to placebo at Month 30, and demonstrated similar treatment effects to the KCCQ-OS score (Figure 2 and Table 4). The distribution for change from Baseline to Month 30 for KCCQ-OS (Figure 3) shows that the proportion of patients with worse KCCQ-OS scores was lower for the pooled VYNDAQEL-treated group compared to placebo, and the proportion with improved scores was higher (Figure 3).
Figure 3: Histogram of Change from Baseline to Month 30 in KCCQ-Overall Summary Score
|
Abbreviation: KCCQ-OS=Kansas City Cardiomyopathy Questionnaire-Overall Summary.
| Abbreviations: 6MWT = 6-Minute Walk Test; KCCQ-OS = Kansas City Cardiomyopathy Questionnaire-Overall Summary; SD = standard deviation; LS = least squares; SE = standard error; CI = confidence interval | |||||
Endpoints | Baseline Mean (SD) | Change from Baseline to Month 30, LS Mean (SE) | Treatment Difference from Placebo | ||
Pooled VYNDAQEL | Placebo | Pooled VYNDAQEL | Placebo | ||
6MWT | 351 | 353 | -55 | -131 | 76 |
KCCQ-OS | 67 | 66 | -7 | -21 | 14 |
Results from the F-S method represented by win ratio for the combined endpoint and its components (all-cause mortality and frequency of CV-related hospitalization) consistently favored VYNDAQEL versus placebo across all subgroups (wild-type, variant and NYHA Class I & II, and III), except for CV-related hospitalization frequency in NYHA Class III (Figure 4). Win ratio is the number of pairs of VYNDAQEL-treated patient "wins" divided by number of pairs of placebo patient "wins." Analyses of 6MWT and KCCQ-OS also favored VYNDAQEL relative to placebo within each subgroup.
Figure 4: Results by Subgroup, Dose, and Components of Primary Analysis
Abbreviations: ATTRm = variant transthyretin amyloid, ATTRwt = wild-type transthyretin amyloid, F-S = Finkelstein Schoenfeld, CI = Confidence Interval
*F-S results presented using win ratio (based on all-cause mortality and frequency of cardiovascular hospitalization)
Heart transplants and cardiac mechanical assist devices treated as death.
Results of the primary analysis, 6MWT at Month 30 and KCCQ-OS at Month 30 were statistically significant for both the 80-mg and 20-mg doses of VYNDAQEL vs. placebo, with similar results for both doses.
Health Professional Information
{{section_name_patient}}
{{section_body_html_patient}}
Resources
Didn’t find what you were looking for? Contact us.
Chat online with Pfizer Medical Information regarding your inquiry on a Pfizer medicine.
*Speak with a Pfizer Medical Information Professional regarding your medical inquiry. Available 9AM-5Pm ET Monday to Friday; excluding holidays.
Submit a medical question for Pfizer prescription products.
Report Adverse Event
To report an adverse event related to the Pfizer-BioNTech COVID-19 Vaccine, and you are not part of a clinical trial* for this product, click the link below to submit your information:
Pfizer Safety Reporting Site*If you are involved in a clinical trial for this product, adverse events should be reported to your coordinating study site.
If you cannot use the above website, or would like to report an adverse event related to a different Pfizer product, please call Pfizer Safety at (800) 438-1985.
You may also contact the U.S. Food and Drug Administration (FDA) directly to report adverse events or product quality concerns either online at www.fda.gov/medwatch or call (800) 822-7967.