TOVIAZ® Clinical Studies
(fesoterodine fumarate)
14 CLINICAL STUDIES
14.1 Adult Overactive Bladder
The efficacy of Toviaz extended-release tablets was evaluated in two, Phase 3, randomized, double-blind, placebo-controlled, 12-week studies for the treatment of overactive bladder with symptoms of urge urinary incontinence, urgency, and urinary frequency. Entry criteria required that patients have symptoms of overactive bladder for ≥6-months duration, at least 8 micturitions per day, and at least 6 urinary urgency episodes or 3 urge incontinence episodes per 3-day diary period. Patients were randomized to a fixed dose of Toviaz 4 or 8 mg/day or placebo. In one of these studies, 290 patients were randomized to an active control arm (an oral antimuscarinic agent). For the combined studies, a total of 554 patients received placebo, 554 patients received Toviaz 4 mg/day, and 566 patients received Toviaz 8 mg/day. The majority of patients were Caucasian (91%) and female (79%) with a mean age of 58 years (range 19–91 years).
The primary efficacy endpoints were the mean change in the number of urge urinary incontinence episodes per 24 hours and the mean change in the number of micturitions (frequency) per 24 hours. An important secondary endpoint was the mean change in the voided volume per micturition.
Results for the primary endpoints and for mean change in voided volume per micturition from the two 12-week clinical studies of Toviaz are reported in Table 10.
| Study 1 | Study 2 | |||||
|---|---|---|---|---|---|---|
| Parameter | Placebo N=279 | Toviaz 4mg/day N=265 | Toviaz 8mg/day N=276 | Placebo N=266 | Toviaz 4mg/day N=267 | Toviaz 8mg/day N=267 |
| vs. = versus | ||||||
| ||||||
Number of urge incontinence episodes per 24 hours* | ||||||
Baseline | 3.7 | 3.8 | 3.7 | 3.7 | 3.9 | 3.9 |
Change from baseline | -1.20 | -2.06 | -2.27 | -1.00 | -1.77 | -2.42 |
p-value vs. placebo | - | 0.001 | <0.001 | - | <0.003 | <0.001 |
Number of micturitions per 24 hours | ||||||
Baseline | 12.0 | 11.6 | 11.9 | 12.2 | 12.9 | 12.0 |
Change from baseline | -1.02 | -1.74 | -1.94 | -1.02 | -1.86 | -1.94 |
p-value vs. placebo | - | <0.001 | <0.001 | - | 0.032 | <0.001 |
Voided volume per micturition (mL) | ||||||
Baseline | 150 | 160 | 154 | 159 | 152 | 156 |
Change from baseline | 10 | 27 | 33 | 8 | 17 | 33 |
p-value vs. placebo | - | <0.001 | <0.001 | - | 0.150 | <0.001 |
Figures 1–4: The following figures show change from baseline over time in number of micturitions and urge urinary incontinence episodes per 24 h in the two studies.
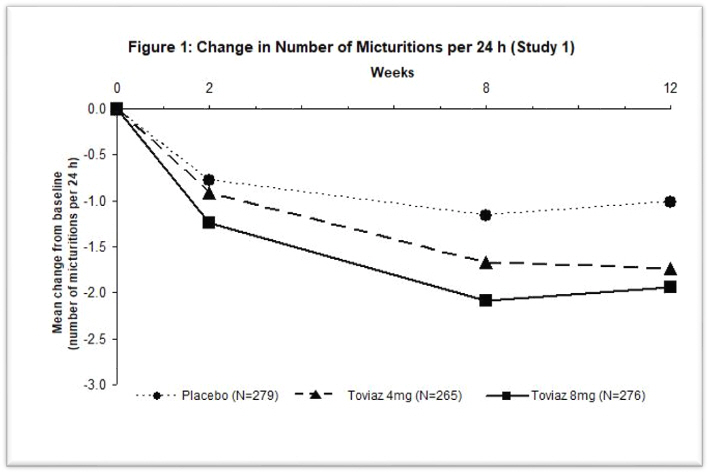
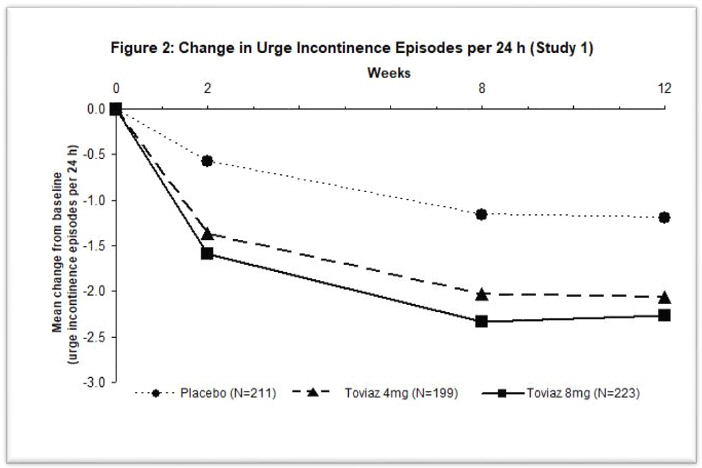
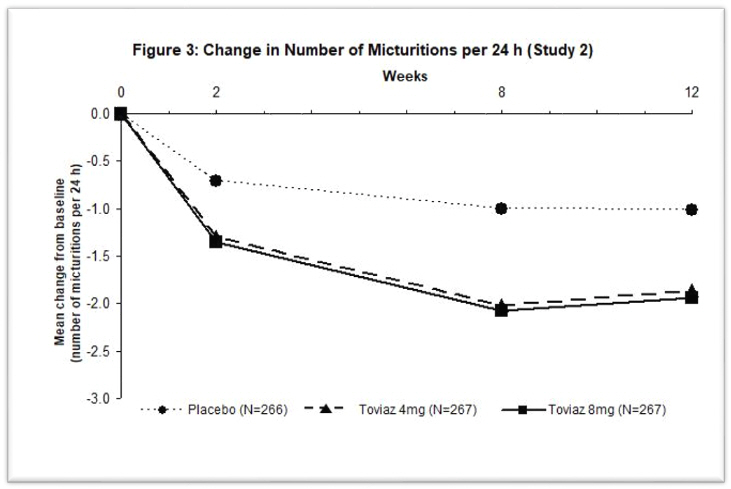
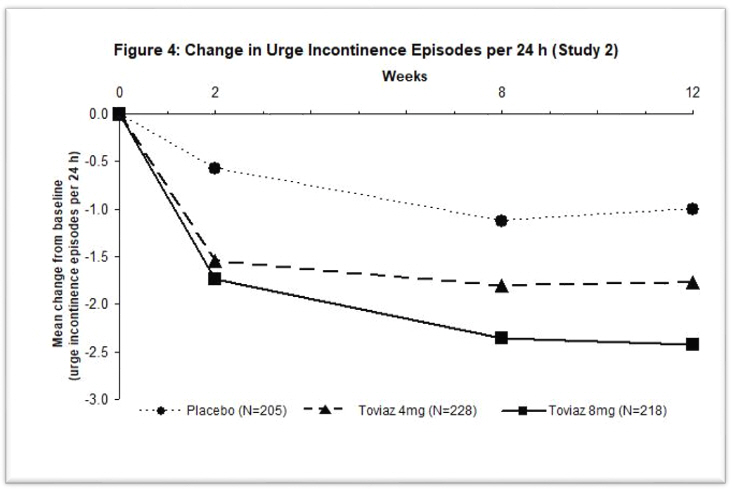
A reduction in number of urge urinary incontinence episodes per 24 hours was observed for both doses as compared to placebo as early as two weeks after starting Toviaz therapy.
14.2 Pediatric Neurogenic Detrusor Overactivity
The efficacy of Toviaz was evaluated in Study 3 (NCT01557244), a Phase 3, randomized, open-label study consisting of a 12-week efficacy phase followed by a 12-week safety extension phase in pediatric patients from 6 years to 17 years of age. Two cohorts were studied. Cohort 1 (patients weighing greater than 25 kg) received a fixed dose of Toviaz 4 mg or Toviaz 8 mg tablets orally once daily, or once daily. In the safety extension phase, patients randomized to the active comparator were switched to Toviaz 4 mg or Toviaz 8 mg once daily. For study inclusion, patients were required to have stable neurological disease and clinically or urodynamically-demonstrated NDO. Cohort 2 patients weighing less than 25 kg received an investigational fesoterodine formulation.
During the 12-week efficacy phase, 124 patients (69 males and 55 females) were randomized to receive Toviaz 4 mg (N=42), Toviaz 8 mg (N=42), or active comparator (N=40) orally once daily. The majority of patients were Caucasian (52%) or Asian (44%) with a mean age of 11 years (range 6 years to 17 years) and a mean weight of 42.8 kg (range 25.1 to 96.0 kg).
Primary Endpoint
The primary efficacy endpoint was the mean change from baseline in maximum cystometric bladder capacity (MCBC) at Week 12.
Treatment with Toviaz 4 mg or 8 mg daily resulted in improvements from baseline to Week 12 in the primary efficacy endpoint, MCBC, for pediatric patients, with numerically higher changes from baseline for Toviaz 8 mg daily than for Toviaz 4 mg daily.
Results for the primary endpoint MCBC are reported in Table 11.
| CI = confidence interval | ||
| Baseline is defined as the last available measurement prior to the start of treatment. | ||
| N is the number of patients who took at least one dose and provided a valid value for MCBC at baseline. | ||
| ||
Toviaz 4 mg | Toviaz 8 mg | |
N | 41 | 41 |
Baseline | 195.1 | 173.3 |
Change from baseline (95% CI)* | 58.1 (28.8, 87.4) | 83.4 (54.2, 112.5) |
Secondary Endpoints
Results for other urodynamic secondary efficacy endpoints and selected secondary efficacy endpoints derived from patient urinary diaries are reported in Tables 12 and 13, respectively.
| Toviaz 4 mg | Toviaz 8 mg | |
|---|---|---|
| CI = confidence interval; IDC = involuntary detrusor contractions | ||
| Baseline is defined as the last available measurement prior to the start of treatment. | ||
| N is the number of patients who took at least one dose and provided valid endpoint data at baseline . | ||
| ||
Detrusor pressure at maximum bladder capacity (cmH2O) | ||
N | 40 | 41 |
Baseline | 26.5 | 27.2 |
Change from Baseline | -2.9 | -1.6 |
Number and percentage of patients with IDC at Baseline but not at Week 12 (n (%)) | ||
N | 41 | 41 |
n (%) | 9 (22.0) | 18 (43.9) |
Bladder volume at first IDC (mL) | ||
N | 26 | 36 |
Baseline | 88.6 | 88.5 |
Change from Baseline | 30.5 | 26.1 |
Bladder compliance (mL/cmH20) | ||
N | 40 | 40 |
Baseline | 13.8 | 10.1 |
Change from Baseline | 6.4 | 5.4 |
| Toviaz 4 mg | Toviaz 8 mg | |
|---|---|---|
| CI = confidence interval | ||
| Baseline is defined as the last available measurement prior to the start of treatment. | ||
| N is the number of patients who took at least one dose and provided valid endpoint data at baseline. | ||
| ||
Number of incontinence episodes per 24 hours* | ||
N | 33 | 33 |
Baseline | 2.8 | 2.7 |
Change from Baseline | -0.5 | -0.9 |
Maximum catheterized urine volume per 24 hours (mL) | ||
N | 36 | 32 |
Baseline | 222.5 | 164.7 |
Change from Baseline | 31.6 | 51.0 |
Find TOVIAZ® medical information:
Find TOVIAZ® medical information:
TOVIAZ® Quick Finder
Health Professional Information
Clinical Studies
14 CLINICAL STUDIES
14.1 Adult Overactive Bladder
The efficacy of Toviaz extended-release tablets was evaluated in two, Phase 3, randomized, double-blind, placebo-controlled, 12-week studies for the treatment of overactive bladder with symptoms of urge urinary incontinence, urgency, and urinary frequency. Entry criteria required that patients have symptoms of overactive bladder for ≥6-months duration, at least 8 micturitions per day, and at least 6 urinary urgency episodes or 3 urge incontinence episodes per 3-day diary period. Patients were randomized to a fixed dose of Toviaz 4 or 8 mg/day or placebo. In one of these studies, 290 patients were randomized to an active control arm (an oral antimuscarinic agent). For the combined studies, a total of 554 patients received placebo, 554 patients received Toviaz 4 mg/day, and 566 patients received Toviaz 8 mg/day. The majority of patients were Caucasian (91%) and female (79%) with a mean age of 58 years (range 19–91 years).
The primary efficacy endpoints were the mean change in the number of urge urinary incontinence episodes per 24 hours and the mean change in the number of micturitions (frequency) per 24 hours. An important secondary endpoint was the mean change in the voided volume per micturition.
Results for the primary endpoints and for mean change in voided volume per micturition from the two 12-week clinical studies of Toviaz are reported in Table 10.
| Study 1 | Study 2 | |||||
|---|---|---|---|---|---|---|
| Parameter | Placebo N=279 | Toviaz 4mg/day N=265 | Toviaz 8mg/day N=276 | Placebo N=266 | Toviaz 4mg/day N=267 | Toviaz 8mg/day N=267 |
| vs. = versus | ||||||
| ||||||
Number of urge incontinence episodes per 24 hours* | ||||||
Baseline | 3.7 | 3.8 | 3.7 | 3.7 | 3.9 | 3.9 |
Change from baseline | -1.20 | -2.06 | -2.27 | -1.00 | -1.77 | -2.42 |
p-value vs. placebo | - | 0.001 | <0.001 | - | <0.003 | <0.001 |
Number of micturitions per 24 hours | ||||||
Baseline | 12.0 | 11.6 | 11.9 | 12.2 | 12.9 | 12.0 |
Change from baseline | -1.02 | -1.74 | -1.94 | -1.02 | -1.86 | -1.94 |
p-value vs. placebo | - | <0.001 | <0.001 | - | 0.032 | <0.001 |
Voided volume per micturition (mL) | ||||||
Baseline | 150 | 160 | 154 | 159 | 152 | 156 |
Change from baseline | 10 | 27 | 33 | 8 | 17 | 33 |
p-value vs. placebo | - | <0.001 | <0.001 | - | 0.150 | <0.001 |
Figures 1–4: The following figures show change from baseline over time in number of micturitions and urge urinary incontinence episodes per 24 h in the two studies.
A reduction in number of urge urinary incontinence episodes per 24 hours was observed for both doses as compared to placebo as early as two weeks after starting Toviaz therapy.
14.2 Pediatric Neurogenic Detrusor Overactivity
The efficacy of Toviaz was evaluated in Study 3 (NCT01557244), a Phase 3, randomized, open-label study consisting of a 12-week efficacy phase followed by a 12-week safety extension phase in pediatric patients from 6 years to 17 years of age. Two cohorts were studied. Cohort 1 (patients weighing greater than 25 kg) received a fixed dose of Toviaz 4 mg or Toviaz 8 mg tablets orally once daily, or once daily. In the safety extension phase, patients randomized to the active comparator were switched to Toviaz 4 mg or Toviaz 8 mg once daily. For study inclusion, patients were required to have stable neurological disease and clinically or urodynamically-demonstrated NDO. Cohort 2 patients weighing less than 25 kg received an investigational fesoterodine formulation.
During the 12-week efficacy phase, 124 patients (69 males and 55 females) were randomized to receive Toviaz 4 mg (N=42), Toviaz 8 mg (N=42), or active comparator (N=40) orally once daily. The majority of patients were Caucasian (52%) or Asian (44%) with a mean age of 11 years (range 6 years to 17 years) and a mean weight of 42.8 kg (range 25.1 to 96.0 kg).
Primary Endpoint
The primary efficacy endpoint was the mean change from baseline in maximum cystometric bladder capacity (MCBC) at Week 12.
Treatment with Toviaz 4 mg or 8 mg daily resulted in improvements from baseline to Week 12 in the primary efficacy endpoint, MCBC, for pediatric patients, with numerically higher changes from baseline for Toviaz 8 mg daily than for Toviaz 4 mg daily.
Results for the primary endpoint MCBC are reported in Table 11.
| CI = confidence interval | ||
| Baseline is defined as the last available measurement prior to the start of treatment. | ||
| N is the number of patients who took at least one dose and provided a valid value for MCBC at baseline. | ||
| ||
Toviaz 4 mg | Toviaz 8 mg | |
N | 41 | 41 |
Baseline | 195.1 | 173.3 |
Change from baseline (95% CI)* | 58.1 (28.8, 87.4) | 83.4 (54.2, 112.5) |
Secondary Endpoints
Results for other urodynamic secondary efficacy endpoints and selected secondary efficacy endpoints derived from patient urinary diaries are reported in Tables 12 and 13, respectively.
| Toviaz 4 mg | Toviaz 8 mg | |
|---|---|---|
| CI = confidence interval; IDC = involuntary detrusor contractions | ||
| Baseline is defined as the last available measurement prior to the start of treatment. | ||
| N is the number of patients who took at least one dose and provided valid endpoint data at baseline . | ||
| ||
Detrusor pressure at maximum bladder capacity (cmH2O) | ||
N | 40 | 41 |
Baseline | 26.5 | 27.2 |
Change from Baseline | -2.9 | -1.6 |
Number and percentage of patients with IDC at Baseline but not at Week 12 (n (%)) | ||
N | 41 | 41 |
n (%) | 9 (22.0) | 18 (43.9) |
Bladder volume at first IDC (mL) | ||
N | 26 | 36 |
Baseline | 88.6 | 88.5 |
Change from Baseline | 30.5 | 26.1 |
Bladder compliance (mL/cmH20) | ||
N | 40 | 40 |
Baseline | 13.8 | 10.1 |
Change from Baseline | 6.4 | 5.4 |
| Toviaz 4 mg | Toviaz 8 mg | |
|---|---|---|
| CI = confidence interval | ||
| Baseline is defined as the last available measurement prior to the start of treatment. | ||
| N is the number of patients who took at least one dose and provided valid endpoint data at baseline. | ||
| ||
Number of incontinence episodes per 24 hours* | ||
N | 33 | 33 |
Baseline | 2.8 | 2.7 |
Change from Baseline | -0.5 | -0.9 |
Maximum catheterized urine volume per 24 hours (mL) | ||
N | 36 | 32 |
Baseline | 222.5 | 164.7 |
Change from Baseline | 31.6 | 51.0 |
Health Professional Information
{{section_name_patient}}
{{section_body_html_patient}}
Resources
Didn’t find what you were looking for? Contact us.
Chat online with Pfizer Medical Information regarding your inquiry on a Pfizer medicine.
*Speak with a Pfizer Medical Information Professional regarding your medical inquiry. Available 9AM-5Pm ET Monday to Friday; excluding holidays.
Submit a medical question for Pfizer prescription products.
Report Adverse Event
To report an adverse event related to the Pfizer-BioNTech COVID-19 Vaccine, and you are not part of a clinical trial* for this product, click the link below to submit your information:
Pfizer Safety Reporting Site*If you are involved in a clinical trial for this product, adverse events should be reported to your coordinating study site.
If you cannot use the above website, or would like to report an adverse event related to a different Pfizer product, please call Pfizer Safety at (800) 438-1985.
You may also contact the U.S. Food and Drug Administration (FDA) directly to report adverse events or product quality concerns either online at www.fda.gov/medwatch or call (800) 822-7967.