PREMPRO® AND PREMPHASE® Clinical Studies
(conjugated estrogens and medroxyprogesterone acetate)
14 CLINICAL STUDIES
14.1 Effects on Vasomotor Symptoms
In the first year of the Health and Osteoporosis, Progestin and Estrogen (HOPE) Study, a total of 2,805 postmenopausal women (average age 53.3 ± 4.9 years) were randomly assigned to one of eight treatment groups of either placebo or conjugated estrogens, with or without medroxyprogesterone acetate. Efficacy for vasomotor symptoms was assessed during the first 12 weeks of treatment in a subset of symptomatic women (n = 241) who had at least seven moderate to severe hot flushes daily, or at least 50 moderate to severe hot flushes during the week before randomization. With PREMPRO 0.625 mg/2.5 mg, 0.45 mg/1.5 mg, and 0.3 mg/1.5 mg, the relief of both the frequency and severity of moderate to severe vasomotor symptoms was shown to be statistically improved compared to placebo at weeks 4 and 12. Table 5 shows the adjusted mean number of hot flushes in the PREMPRO 0.625 mg/2.5 mg, 0.45 mg/1.5 mg, 0.3 mg/1.5 mg, and placebo groups during the initial 12-week period.
| Treatment* (No. of Patients) | -------------------No. of Hot Flushes/Day----------------- | |||
|---|---|---|---|---|
| Time Period (week) | Baseline Mean ± SD | Observed Mean ± SD | Mean Change ± SD | p-Values vs. Placebo† |
0.625 mg/2.5 mg | ||||
4 | 11.98 ± 3.54 | 3.19 ± 3.74 | -8.78 ± 4.72 | <0.001 |
12 | 11.98 ± 3.54 | 1.16 ± 2.22 | -10.82 ± 4.61 | <0.001 |
0.45 mg/1.5 mg | ||||
4 | 12.61 ± 4.29 | 3.64 ± 3.61 | -8.98 ± 4.74 | <0.001 |
12 | 12.61 ± 4.29 | 1.69 ± 3.36 | -10.92 ± 4.63 | <0.001 |
0.3 mg/1.5 mg | ||||
4 | 11.30 ± 3.13 | 3.70 ± 3.29 | -7.60 ± 4.71 | <0.001 |
12 | 11.30 ± 3.13 | 1.31 ± 2.82 | -10.00 ± 4.60 | <0.001 |
Placebo | ||||
4 | 11.69 ± 3.87 | 7.89 ± 5.28 | -3.80 ± 4.71 | - |
12 | 11.69 ± 3.87 | 5.71 ± 5.22 | -5.98 ± 4.60 | - |
14.2 Effects on Vulvar and Vaginal Atrophy
Results of vaginal maturation indexes at cycles 6 and 13 showed that the differences from placebo were statistically significant (p < 0.001) for all treatment groups.
14.3 Effects on the Endometrium
In a 1-year clinical trial of 1,376 women (average age 54 ± 4.6 years) randomized to PREMPRO 0.625 mg/2.5 mg (n = 340), PREMPRO 0.625 mg/5 mg (n = 338), PREMPHASE 0.625 mg/5 mg (n = 351), or Premarin 0.625 mg alone (n = 347), results of evaluable biopsies at 12 months (n = 279, 274, 277, and 283, respectively) showed a reduced risk of endometrial hyperplasia in the two PREMPRO treatment groups (less than 1 percent) and in the PREMPHASE treatment group (less than 1 percent; 1 percent when focal hyperplasia was included) compared to the Premarin group (8 percent; 20 percent when focal hyperplasia was included), see Table 6.
| --------------------------Groups------------------------- | ||||
|---|---|---|---|---|
| PREMPRO | PREMPRO | PREMPHASE | Premarin | |
| 0.625 mg/2.5 mg | 0.625 mg/5 mg | 0.625 mg/5 mg | 0.625 mg | |
| ||||
Total number of patients | 340 | 338 | 351 | 347 |
Number of patients with evaluable biopsies | 279 | 274 | 277 | 283 |
No. (%) of patients with biopsies: | ||||
• All focal and non-focal hyperplasia | 2 (<1)* | 0 (0)* | 3 (1)* | 57 (20) |
• Excluding focal cystic hyperplasia | 2 (<1)* | 0 (0)* | 1 (<1)* | 25 (8) |
In the first year of the Health and Osteoporosis, Progestin and Estrogen (HOPE) Study, 2,001 women (average age 53.3 ± 4.9 years), of whom 88 percent were Caucasian, were treated with either Premarin 0.625 mg alone (n = 348), Premarin 0.45 mg alone (n = 338), Premarin 0.3 mg alone (n = 326) or PREMPRO 0.625 mg/2.5 mg (n = 331), PREMPRO 0.45 mg/1.5 mg (n = 331) or PREMPRO 0.3 mg/1.5 mg (n = 327). Results of evaluable endometrial biopsies at 12 months showed a reduced risk of endometrial hyperplasia or cancer in the PREMPRO treatment groups compared with the corresponding Premarin alone treatment groups, except for the PREMPRO 0.3 mg/1.5 mg and Premarin 0.3 mg alone groups, in each of which there was only 1 case, see Table 7.
No endometrial hyperplasia or cancer was noted in those patients treated with the continuous combined regimens who continued for a second year in the osteoporosis and metabolic substudy of the HOPE study, see Table 8.
| -----------------------------------Groups--------------------------------- | ||||||
|---|---|---|---|---|---|---|
| Patient | Prempro 0.625 mg/2.5 mg | Premarin 0.625 mg | Prempro 0.45 mg/1.5 mg | Premarin 0.45 mg | Prempro 0.3 mg/1.5 mg | Premarin 0.3 mg |
| ||||||
Total number of patients | 331 | 348 | 331 | 338 | 327 | 326 |
Number of patients with evaluable biopsies | 278 | 249 | 272 | 279 | 271 | 269 |
No. (%) of patients with biopsies: | ||||||
0 (0)§ | 20 (8) | 9 (3) | 1 (<1)¶ | 1 (<1)* | ||
| -------------------------------Groups------------------------------ | ||||||
|---|---|---|---|---|---|---|
| Patient | Prempro 0.625 mg/2.5 mg | Premarin 0.625 mg | Prempro 0.45 mg/1.5 mg | Premarin 0.45 mg | Prempro 0.3 mg/1.5 mg | Premarin 0.3 mg |
| ||||||
Total number of patients | 75 | 65 | 75 | 74 | 79 | 73 |
Number of patients with evaluable biopsies | 62 | 55 | 69 | 67 | 75 | 63 |
No. (%) of patients with biopsies: | ||||||
0 (0)§ | 15 (27) | 0 (0)§ | 10 (15) | 0 (0)§ | 2 (3) | |
14.4 Effects on Uterine Bleeding or Spotting
The effects of PREMPRO on uterine bleeding or spotting, as recorded on daily diary cards, were evaluated in 2 clinical trials. Results are shown in Figures 1 and 2.
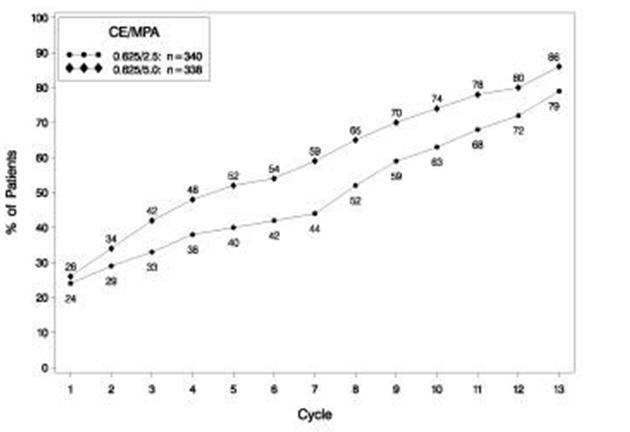
FIGURE 1. PATIENTS WITH CUMULATIVE AMENORRHEA OVER TIME PERCENTAGES OF WOMEN WITH NO BLEEDING OR SPOTTING AT A GIVEN CYCLE THROUGH CYCLE 13 INTENT-TO-TREAT POPULATION, LOCF
Note: The percentage of patients who were amenorrheic in a given cycle and through cycle 13 is shown. If data were missing, the bleeding value from the last reported day was carried forward (LOCF).
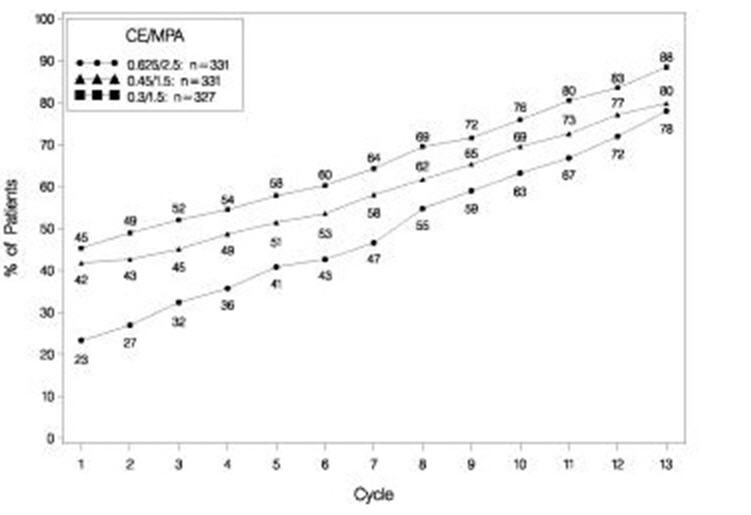
FIGURE 2. PATIENTS WITH CUMULATIVE AMENORRHEA OVER TIME PERCENTAGES OF WOMEN WITH NO BLEEDING OR SPOTTING AT A GIVEN CYCLE THROUGH CYCLE 13 INTENT-TO-TREAT POPULATION, LOCF
Note: The percentage of patients who were amenorrheic in a given cycle and through cycle 13 is shown. If data were missing, the bleeding value from the last reported day was carried forward (LOCF).
14.5 Effects on Bone Mineral Density
Health and Osteoporosis, Progestin and Estrogen (HOPE) Study
The HOPE study was a double-blind, randomized, placebo/active-drug-controlled, multicenter study of healthy postmenopausal women with an intact uterus. Subjects (mean age 53.3 ± 4.9 years) were 2.3 ± 0.9 years on average since menopause and took one 600 mg tablet of elemental calcium (Caltrate™) daily. Subjects were not given Vitamin D supplements. They were treated with PREMPRO 0.625 mg/2.5 mg, 0.45 mg/1.5 mg or 0.3 mg/1.5 mg, comparable doses of Premarin alone, or placebo. Prevention of bone loss was assessed by measurement of bone mineral density (BMD), primarily at the anteroposterior lumbar spine (L2 to L4). Secondarily, BMD measurements of the total body, femoral neck, and trochanter were also analyzed. Serum osteocalcin, urinary calcium, and N-telopeptide were used as bone turnover markers (BTM) at cycles 6, 13, 19, and 26.
Intent-to-treat subjects
All active treatment groups showed significant differences from placebo in each of the four BMD endpoints. These significant differences were seen at cycles 6, 13, 19, and 26.
The percent changes from baseline to final evaluation are shown in Table 9.
| Region Evaluated Treatment Group* | No. of Subjects | Baseline (g/cm2) Mean ± SD | Change from Baseline (%) Adjusted Mean ± SE | p-Value vs. Placebo |
|---|---|---|---|---|
| ||||
L2 to L4 BMD | ||||
0.625/2.5 | 81 | 1.14 ± 0.16 | 3.28 ± 0.37 | <0.001 |
0.45/1.5 | 89 | 1.16 ± 0.14 | 2.18 ± 0.35 | <0.001 |
0.3/1.5 | 90 | 1.14 ± 0.15 | 1.71 ± 0.35 | <0.001 |
Placebo | 85 | 1.14 ± 0.14 | -2.45 ± 0.36 | |
Total body BMD | ||||
0.625/2.5 | 81 | 1.14 ± 0.08 | 0.87 ± 0.17 | <0.001 |
0.45/1.5 | 89 | 1.14 ± 0.07 | 0.59 ± 0.17 | <0.001 |
0.3/1.5 | 91 | 1.13 ± 0.08 | 0.60 ± 0.16 | <0.001 |
Placebo | 85 | 1.13 ± 0.08 | -1.50 ± 0.17 | |
Femoral neck BMD | ||||
0.625/2.5 | 81 | 0.89 ± 0.14 | 1.62 ± 0.46 | <0.001 |
0.45/1.5 | 89 | 0.89 ± 0.12 | 1.48 ± 0.44 | <0.001 |
0.3/1.5 | 91 | 0.86 ± 0.11 | 1.31 ± 0.43 | <0.001 |
Placebo | 85 | 0.88 ± 0.14 | -1.72 ± 0.45 | |
Femoral trochanter BMD | ||||
0.625/2.5 | 81 | 0.77 ± 0.14 | 3.35 ± 0.59 | 0.002 |
0.45/1.5 | 89 | 0.76 ± 0.12 | 2.84 ± 0.57 | 0.011 |
0.3/1.5 | 91 | 0.76 ± 0.12 | 3.93 ± 0.56 | <0.001 |
Placebo | 85 | 0.75 ± 0.12 | 0.81 ± 0.58 | |
Figure 3 shows the cumulative percentage of subjects with percent changes from baseline in spine BMD equal to or greater than the percent change shown on the x-axis.
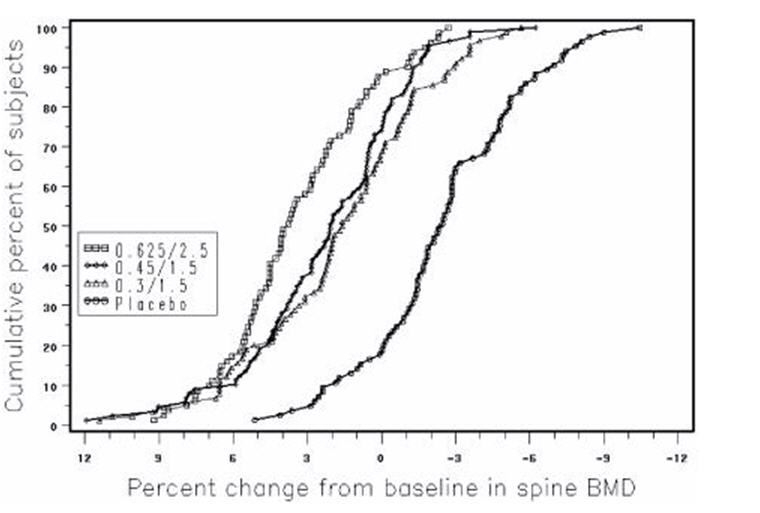
FIGURE 3. CUMULATIVE PERCENT OF SUBJECTS WITH CHANGES FROM BASELINE IN SPINE BMD OF GIVEN MAGNITUDE OR GREATER IN PREMARIN/MPA AND PLACEBO GROUPS
The mean percent changes from baseline in L2 to L4 BMD for women who completed the bone density study are shown with standard error bars by treatment group in Figure 4. Significant differences between each of the PREMPRO dosage groups and placebo were found at cycles 6, 13, 19, and 26.
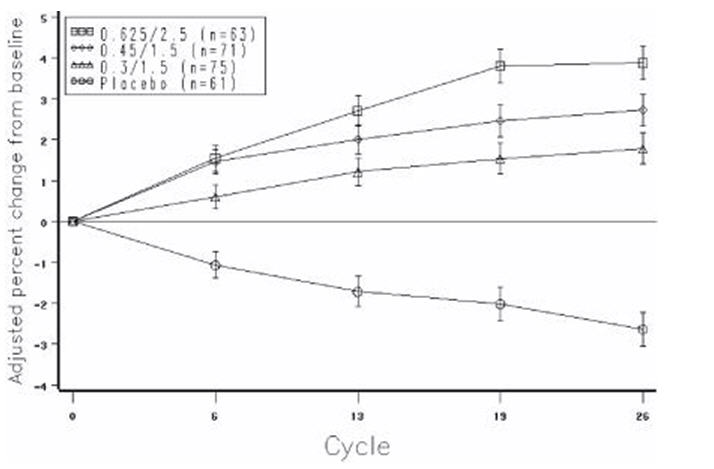
FIGURE 4. ADJUSTED MEAN (SE) PERCENT CHANGE FROM BASELINE AT EACH CYCLE IN SPINE BMD: SUBJECTS COMPLETING IN PREMARIN/MPA GROUPS AND PLACEBO
The bone turnover markers, serum osteocalcin and urinary N-telopeptide, significantly decreased (p < 0.001) in all active-treatment groups at cycles 6, 13, 19, and 26 compared with the placebo group. Larger mean decreases from baseline were seen with the active groups than with the placebo group. Significant differences from placebo were seen less frequently in urine calcium; only with PREMPRO 0.625 mg/2.5 mg and 0.45 mg/1.5 mg were there significantly larger mean decreases than with placebo at 3 or more of the 4 time points.
14.6 Women's Health Initiative Studies
The WHI enrolled approximately 27,000 predominantly healthy postmenopausal women in two substudies to assess the risks and benefits of daily oral CE (0.625 mg)-alone or in combination with MPA (2.5 mg) compared to placebo in the prevention of certain chronic diseases. The primary endpoint was the incidence of CHD (defined as nonfatal MI, silent MI and CHD death), with invasive breast cancer as the primary adverse outcome. A "global index" included the earliest occurrence of CHD, invasive breast cancer, stroke, PE, endometrial cancer (only in the CE plus MPA substudy), colorectal cancer, hip fracture, or death due to other causes. These substudies did not evaluate the effects of CE plus MPA or CE-alone on menopausal symptoms.
WHI Estrogen Plus Progestin Substudy
The WHI estrogen plus progestin substudy was stopped early. According to the predefined stopping rule, after an average follow-up of 5.6 years of treatment, the increased risk of invasive breast cancer and cardiovascular events exceeded the specified benefits included in the "global index." The absolute excess risk of events included in the "global index" was 19 per 10,000 women-years.
For those outcomes included in the WHI "global index" that reached statistical significance after 5.6 years of follow-up, the absolute excess risks per 10,000 women-years in the group treated with CE plus MPA were 7 more CHD events, 8 more strokes, 10 more PEs, and 8 more invasive breast cancers, while the absolute risk reductions per 10,000 women-years were 6 fewer colorectal cancers and 5 fewer hip fractures.
Results of the CE plus MPA substudy, which included 16,608 women (average 63 years of age, range 50 to 79; 83.9 percent White, 6.8 percent Black, 5.4 percent Hispanic, 3.9 percent Other) are presented in Table 10. These results reflect centrally adjudicated data after an average follow-up of 5.6 years.
| Relative Risk CE/MPA vs. Placebo (95% nCI‡) | CE/MPA n = 8,506 | Placebo n = 8,102 | |
|---|---|---|---|
| Event | Absolute Risk per 10,000 Women-Years | ||
| |||
CHD events | 1.23 (0.99–1.53) | 41 | 34 |
Non-fatal MI | 1.28 (1.00–1.63) | 31 | 25 |
CHD death | 1.10 (0.70–1.75) | 8 | 8 |
All Strokes | 1.31 (1.03–1.68) | 33 | 25 |
Ischemic stroke | 1.44 (1.09–1.90) | 26 | 18 |
Deep vein thrombosis§ | 1.95 (1.43–2.67) | 26 | 13 |
Pulmonary embolism | 2.13 (1.45–3.11) | 18 | 8 |
Invasive breast cancer¶ | 1.24 (1.01–1.54) | 41 | 33 |
Colorectal cancer | 0.61 (0.42–0.87) | 10 | 16 |
Endometrial cancer§ | 0.81 (0.48–1.36) | 6 | 7 |
Cervical cancer§ | 1.44 (0.47–4.42) | 2 | 1 |
Hip fracture | 0.67 (0.47–0.96) | 11 | 16 |
Vertebral fractures§ | 0.65 (0.46–0.92) | 11 | 17 |
Lower arm/wrist fractures§ | 0.71 (0.59–0.85) | 44 | 62 |
Total fractures§ | 0.76 (0.69–0.83) | 152 | 199 |
Overall Mortality# | 1.00 (0.83–1.19) | 52 | 52 |
Global IndexÞ | 1.13 (1.02–1.25) | 184 | 165 |
Timing of the initiation of estrogen plus progestin therapy relative to the start of menopause may affect the overall risk benefit profile. The WHI estrogen plus progestin substudy stratified by age showed in women 50 to 59 years of age, a non-significant trend toward reduced risk for overall mortality [hazard ratio (HR) 0.69 (95 percent CI, 0.44–1.07)].
WHI Estrogen-Alone Substudy
The WHI estrogen-alone substudy was stopped early because an increased risk of stroke was observed, and it was deemed that no further information would be obtained regarding the risks and benefits of estrogen-alone in predetermined primary endpoints.
Results of the estrogen-alone substudy, which included 10,739 women (average 63 years of age, range 50 to 79; 75.3 percent White, 15.1 percent Black, 6.1 percent Hispanic, 3.6 percent Other) after an average follow-up of 7.1 years, are presented in Table 11.
| Relative Risk CE vs. Placebo (95% nCI†) | CE n = 5,310 | Placebo n = 5,429 | |
|---|---|---|---|
| Event | Absolute Risk per 10,000 Women-Years | ||
| |||
CHD events‡ | 0.95 (0.78–1.16) | 54 | 57 |
Non-fatal MI‡ | 0.91 (0.73–1.14) | 40 | 43 |
CHD death‡ | 1.01 (0.71–1.43) | 16 | 16 |
All Strokes‡ | 1.33 (1.05–1.68) | 45 | 33 |
Ischemic stroke‡ | 1.55 (1.19–2.01) | 38 | 25 |
1.47 (1.06–2.06) | 23 | 15 | |
Pulmonary embolism‡ | 1.37 (0.90–2.07) | 14 | 10 |
Invasive breast cancer‡ | 0.80 (0.62–1.04) | 28 | 34 |
Colorectal cancer¶ | 1.08 (0.75–1.55) | 17 | 16 |
Hip fracture‡ | 0.65 (0.45–0.94) | 12 | 19 |
0.64 (0.44–0.93) | 11 | 18 | |
0.58 (0.47–0.72) | 35 | 59 | |
0.71 (0.64–0.80) | 144 | 197 | |
1.08 (0.88–1.32) | 53 | 50 | |
1.04 (0.88–1.22) | 79 | 75 | |
Global IndexÞ | 1.02 (0.92–1.13) | 206 | 201 |
For those outcomes included in the WHI "global index" that reached statistical significance, the absolute excess risk per 10,000 women-years in the group treated with CE-alone was 12 more strokes while the absolute risk reduction per 10,000 women-years was 7 fewer hip fractures.9 The absolute excess risk of events included in the "global index" was a non-significant 5 events per 10,000 women-years. There was no difference between the groups in terms of all-cause mortality.
No overall difference for primary CHD events (nonfatal MI, silent MI and CHD death) and invasive breast cancer incidence in women receiving CE-alone compared with placebo was reported in final centrally adjudicated results from the estrogen-alone substudy, after an average follow up of 7.1 years.
Centrally adjudicated results for stroke events from the estrogen-alone substudy, after an average follow-up of 7.1 years, reported no significant difference in distribution of stroke subtype or severity, including fatal strokes, in women receiving CE-alone compared to placebo. Estrogen-alone increased the risk for ischemic stroke, and this excess risk was present in all subgroups of women examined.10
Timing of the initiation of estrogen-alone therapy relative to the start of menopause may affect the overall risk benefit profile. The WHI estrogen-alone substudy, stratified by age, showed in women 50 to 59 years of age a non-significant trend toward reduced risk for CHD [HR 0.63 (95 percent CI, 0.36–1.09)] and overall mortality [HR 0.71 (95 percent CI, 0.46–1.11)].
14.7 Women's Health Initiative Memory Study
The WHIMS estrogen plus progestin ancillary study of WHI enrolled 4,532 predominantly healthy postmenopausal women 65 years of age and older (47 percent were 65 to 69 years of age; 35 percent were 70 to 74 years of age; and 18 percent were 75 years of age and older) to evaluate the effects of daily CE (0.625 mg) plus MPA (2.5 mg) on the incidence of probable dementia (primary outcome) compared to placebo.
After an average follow-up of 4 years, the relative risk of probable dementia for CE plus MPA versus placebo was 2.05 (95 percent CI, 1.21–3.48). The absolute risk of probable dementia for CE plus MPA versus placebo was 45 versus 22 cases per 10,000 women-years. Probable dementia as defined in this study included Alzheimer's disease (AD), vascular dementia (VaD) and mixed types (having features of both AD and VaD). The most common classification of probable dementia in the treatment group and the placebo group was AD. Since the ancillary study was conducted in women 65 to 79 years of age, it is unknown whether these findings apply to younger postmenopausal women [see Warnings and Precautions (5.3), and Use in Specific Populations (8.5)].
The WHIMS estrogen-alone ancillary study of WHI enrolled 2,947 predominantly healthy hysterectomized postmenopausal women 65 to 79 years of age and older (45 percent were 65 to 69 years of age; 36 percent were 70 to 74 years of age; 19 percent were 75 years of age and older) to evaluate the effects of daily CE (0.625 mg)-alone on the incidence of probable dementia (primary outcome) compared to placebo.
After an average follow-up of 5.2 years, the relative risk of probable dementia for CE-alone versus placebo was 1.49 (95 percent CI, 0.83–2.66). The absolute risk of probable dementia for CE-alone versus placebo was 37 versus 25 cases per 10,000 women-years. Probable dementia as defined in this study included AD, VaD and mixed types (having features of both AD and VaD). The most common classification of probable dementia in the treatment group and the placebo group was AD. Since the ancillary study was conducted in women 65 to 79 years of age, it is unknown whether these findings apply to younger postmenopausal women [see Warnings and Precautions (5.3), and Use in Specific Populations (8.5)].
When data from the two populations were pooled as planned in the WHIMS protocol, the reported overall relative risk for probable dementia was 1.76 (95 percent CI, 1.19–2.60). Differences between groups became apparent in the first year of treatment. It is unknown whether these findings apply to younger postmenopausal women [see Warnings and Precautions (5.3), and Use in Specific Populations (8.5)].
Find PREMPRO® AND PREMPHASE® medical information:
Find PREMPRO® AND PREMPHASE® medical information:
PREMPRO® AND PREMPHASE® Quick Finder
Health Professional Information
Clinical Studies
14 CLINICAL STUDIES
14.1 Effects on Vasomotor Symptoms
In the first year of the Health and Osteoporosis, Progestin and Estrogen (HOPE) Study, a total of 2,805 postmenopausal women (average age 53.3 ± 4.9 years) were randomly assigned to one of eight treatment groups of either placebo or conjugated estrogens, with or without medroxyprogesterone acetate. Efficacy for vasomotor symptoms was assessed during the first 12 weeks of treatment in a subset of symptomatic women (n = 241) who had at least seven moderate to severe hot flushes daily, or at least 50 moderate to severe hot flushes during the week before randomization. With PREMPRO 0.625 mg/2.5 mg, 0.45 mg/1.5 mg, and 0.3 mg/1.5 mg, the relief of both the frequency and severity of moderate to severe vasomotor symptoms was shown to be statistically improved compared to placebo at weeks 4 and 12. Table 5 shows the adjusted mean number of hot flushes in the PREMPRO 0.625 mg/2.5 mg, 0.45 mg/1.5 mg, 0.3 mg/1.5 mg, and placebo groups during the initial 12-week period.
| Treatment* (No. of Patients) | -------------------No. of Hot Flushes/Day----------------- | |||
|---|---|---|---|---|
| Time Period (week) | Baseline Mean ± SD | Observed Mean ± SD | Mean Change ± SD | p-Values vs. Placebo† |
0.625 mg/2.5 mg | ||||
4 | 11.98 ± 3.54 | 3.19 ± 3.74 | -8.78 ± 4.72 | <0.001 |
12 | 11.98 ± 3.54 | 1.16 ± 2.22 | -10.82 ± 4.61 | <0.001 |
0.45 mg/1.5 mg | ||||
4 | 12.61 ± 4.29 | 3.64 ± 3.61 | -8.98 ± 4.74 | <0.001 |
12 | 12.61 ± 4.29 | 1.69 ± 3.36 | -10.92 ± 4.63 | <0.001 |
0.3 mg/1.5 mg | ||||
4 | 11.30 ± 3.13 | 3.70 ± 3.29 | -7.60 ± 4.71 | <0.001 |
12 | 11.30 ± 3.13 | 1.31 ± 2.82 | -10.00 ± 4.60 | <0.001 |
Placebo | ||||
4 | 11.69 ± 3.87 | 7.89 ± 5.28 | -3.80 ± 4.71 | - |
12 | 11.69 ± 3.87 | 5.71 ± 5.22 | -5.98 ± 4.60 | - |
14.2 Effects on Vulvar and Vaginal Atrophy
Results of vaginal maturation indexes at cycles 6 and 13 showed that the differences from placebo were statistically significant (p < 0.001) for all treatment groups.
14.3 Effects on the Endometrium
In a 1-year clinical trial of 1,376 women (average age 54 ± 4.6 years) randomized to PREMPRO 0.625 mg/2.5 mg (n = 340), PREMPRO 0.625 mg/5 mg (n = 338), PREMPHASE 0.625 mg/5 mg (n = 351), or Premarin 0.625 mg alone (n = 347), results of evaluable biopsies at 12 months (n = 279, 274, 277, and 283, respectively) showed a reduced risk of endometrial hyperplasia in the two PREMPRO treatment groups (less than 1 percent) and in the PREMPHASE treatment group (less than 1 percent; 1 percent when focal hyperplasia was included) compared to the Premarin group (8 percent; 20 percent when focal hyperplasia was included), see Table 6.
| --------------------------Groups------------------------- | ||||
|---|---|---|---|---|
| PREMPRO | PREMPRO | PREMPHASE | Premarin | |
| 0.625 mg/2.5 mg | 0.625 mg/5 mg | 0.625 mg/5 mg | 0.625 mg | |
| ||||
Total number of patients | 340 | 338 | 351 | 347 |
Number of patients with evaluable biopsies | 279 | 274 | 277 | 283 |
No. (%) of patients with biopsies: | ||||
• All focal and non-focal hyperplasia | 2 (<1)* | 0 (0)* | 3 (1)* | 57 (20) |
• Excluding focal cystic hyperplasia | 2 (<1)* | 0 (0)* | 1 (<1)* | 25 (8) |
In the first year of the Health and Osteoporosis, Progestin and Estrogen (HOPE) Study, 2,001 women (average age 53.3 ± 4.9 years), of whom 88 percent were Caucasian, were treated with either Premarin 0.625 mg alone (n = 348), Premarin 0.45 mg alone (n = 338), Premarin 0.3 mg alone (n = 326) or PREMPRO 0.625 mg/2.5 mg (n = 331), PREMPRO 0.45 mg/1.5 mg (n = 331) or PREMPRO 0.3 mg/1.5 mg (n = 327). Results of evaluable endometrial biopsies at 12 months showed a reduced risk of endometrial hyperplasia or cancer in the PREMPRO treatment groups compared with the corresponding Premarin alone treatment groups, except for the PREMPRO 0.3 mg/1.5 mg and Premarin 0.3 mg alone groups, in each of which there was only 1 case, see Table 7.
No endometrial hyperplasia or cancer was noted in those patients treated with the continuous combined regimens who continued for a second year in the osteoporosis and metabolic substudy of the HOPE study, see Table 8.
| -----------------------------------Groups--------------------------------- | ||||||
|---|---|---|---|---|---|---|
| Patient | Prempro 0.625 mg/2.5 mg | Premarin 0.625 mg | Prempro 0.45 mg/1.5 mg | Premarin 0.45 mg | Prempro 0.3 mg/1.5 mg | Premarin 0.3 mg |
| ||||||
Total number of patients | 331 | 348 | 331 | 338 | 327 | 326 |
Number of patients with evaluable biopsies | 278 | 249 | 272 | 279 | 271 | 269 |
No. (%) of patients with biopsies: | ||||||
0 (0)§ | 20 (8) | 9 (3) | 1 (<1)¶ | 1 (<1)* | ||
| -------------------------------Groups------------------------------ | ||||||
|---|---|---|---|---|---|---|
| Patient | Prempro 0.625 mg/2.5 mg | Premarin 0.625 mg | Prempro 0.45 mg/1.5 mg | Premarin 0.45 mg | Prempro 0.3 mg/1.5 mg | Premarin 0.3 mg |
| ||||||
Total number of patients | 75 | 65 | 75 | 74 | 79 | 73 |
Number of patients with evaluable biopsies | 62 | 55 | 69 | 67 | 75 | 63 |
No. (%) of patients with biopsies: | ||||||
0 (0)§ | 15 (27) | 0 (0)§ | 10 (15) | 0 (0)§ | 2 (3) | |
14.4 Effects on Uterine Bleeding or Spotting
The effects of PREMPRO on uterine bleeding or spotting, as recorded on daily diary cards, were evaluated in 2 clinical trials. Results are shown in Figures 1 and 2.
FIGURE 1. PATIENTS WITH CUMULATIVE AMENORRHEA OVER TIME PERCENTAGES OF WOMEN WITH NO BLEEDING OR SPOTTING AT A GIVEN CYCLE THROUGH CYCLE 13 INTENT-TO-TREAT POPULATION, LOCF
Note: The percentage of patients who were amenorrheic in a given cycle and through cycle 13 is shown. If data were missing, the bleeding value from the last reported day was carried forward (LOCF).
FIGURE 2. PATIENTS WITH CUMULATIVE AMENORRHEA OVER TIME PERCENTAGES OF WOMEN WITH NO BLEEDING OR SPOTTING AT A GIVEN CYCLE THROUGH CYCLE 13 INTENT-TO-TREAT POPULATION, LOCF
Note: The percentage of patients who were amenorrheic in a given cycle and through cycle 13 is shown. If data were missing, the bleeding value from the last reported day was carried forward (LOCF).
14.5 Effects on Bone Mineral Density
Health and Osteoporosis, Progestin and Estrogen (HOPE) Study
The HOPE study was a double-blind, randomized, placebo/active-drug-controlled, multicenter study of healthy postmenopausal women with an intact uterus. Subjects (mean age 53.3 ± 4.9 years) were 2.3 ± 0.9 years on average since menopause and took one 600 mg tablet of elemental calcium (Caltrate™) daily. Subjects were not given Vitamin D supplements. They were treated with PREMPRO 0.625 mg/2.5 mg, 0.45 mg/1.5 mg or 0.3 mg/1.5 mg, comparable doses of Premarin alone, or placebo. Prevention of bone loss was assessed by measurement of bone mineral density (BMD), primarily at the anteroposterior lumbar spine (L2 to L4). Secondarily, BMD measurements of the total body, femoral neck, and trochanter were also analyzed. Serum osteocalcin, urinary calcium, and N-telopeptide were used as bone turnover markers (BTM) at cycles 6, 13, 19, and 26.
Intent-to-treat subjects
All active treatment groups showed significant differences from placebo in each of the four BMD endpoints. These significant differences were seen at cycles 6, 13, 19, and 26.
The percent changes from baseline to final evaluation are shown in Table 9.
| Region Evaluated Treatment Group* | No. of Subjects | Baseline (g/cm2) Mean ± SD | Change from Baseline (%) Adjusted Mean ± SE | p-Value vs. Placebo |
|---|---|---|---|---|
| ||||
L2 to L4 BMD | ||||
0.625/2.5 | 81 | 1.14 ± 0.16 | 3.28 ± 0.37 | <0.001 |
0.45/1.5 | 89 | 1.16 ± 0.14 | 2.18 ± 0.35 | <0.001 |
0.3/1.5 | 90 | 1.14 ± 0.15 | 1.71 ± 0.35 | <0.001 |
Placebo | 85 | 1.14 ± 0.14 | -2.45 ± 0.36 | |
Total body BMD | ||||
0.625/2.5 | 81 | 1.14 ± 0.08 | 0.87 ± 0.17 | <0.001 |
0.45/1.5 | 89 | 1.14 ± 0.07 | 0.59 ± 0.17 | <0.001 |
0.3/1.5 | 91 | 1.13 ± 0.08 | 0.60 ± 0.16 | <0.001 |
Placebo | 85 | 1.13 ± 0.08 | -1.50 ± 0.17 | |
Femoral neck BMD | ||||
0.625/2.5 | 81 | 0.89 ± 0.14 | 1.62 ± 0.46 | <0.001 |
0.45/1.5 | 89 | 0.89 ± 0.12 | 1.48 ± 0.44 | <0.001 |
0.3/1.5 | 91 | 0.86 ± 0.11 | 1.31 ± 0.43 | <0.001 |
Placebo | 85 | 0.88 ± 0.14 | -1.72 ± 0.45 | |
Femoral trochanter BMD | ||||
0.625/2.5 | 81 | 0.77 ± 0.14 | 3.35 ± 0.59 | 0.002 |
0.45/1.5 | 89 | 0.76 ± 0.12 | 2.84 ± 0.57 | 0.011 |
0.3/1.5 | 91 | 0.76 ± 0.12 | 3.93 ± 0.56 | <0.001 |
Placebo | 85 | 0.75 ± 0.12 | 0.81 ± 0.58 | |
Figure 3 shows the cumulative percentage of subjects with percent changes from baseline in spine BMD equal to or greater than the percent change shown on the x-axis.
FIGURE 3. CUMULATIVE PERCENT OF SUBJECTS WITH CHANGES FROM BASELINE IN SPINE BMD OF GIVEN MAGNITUDE OR GREATER IN PREMARIN/MPA AND PLACEBO GROUPS
The mean percent changes from baseline in L2 to L4 BMD for women who completed the bone density study are shown with standard error bars by treatment group in Figure 4. Significant differences between each of the PREMPRO dosage groups and placebo were found at cycles 6, 13, 19, and 26.
FIGURE 4. ADJUSTED MEAN (SE) PERCENT CHANGE FROM BASELINE AT EACH CYCLE IN SPINE BMD: SUBJECTS COMPLETING IN PREMARIN/MPA GROUPS AND PLACEBO
The bone turnover markers, serum osteocalcin and urinary N-telopeptide, significantly decreased (p < 0.001) in all active-treatment groups at cycles 6, 13, 19, and 26 compared with the placebo group. Larger mean decreases from baseline were seen with the active groups than with the placebo group. Significant differences from placebo were seen less frequently in urine calcium; only with PREMPRO 0.625 mg/2.5 mg and 0.45 mg/1.5 mg were there significantly larger mean decreases than with placebo at 3 or more of the 4 time points.
14.6 Women's Health Initiative Studies
The WHI enrolled approximately 27,000 predominantly healthy postmenopausal women in two substudies to assess the risks and benefits of daily oral CE (0.625 mg)-alone or in combination with MPA (2.5 mg) compared to placebo in the prevention of certain chronic diseases. The primary endpoint was the incidence of CHD (defined as nonfatal MI, silent MI and CHD death), with invasive breast cancer as the primary adverse outcome. A "global index" included the earliest occurrence of CHD, invasive breast cancer, stroke, PE, endometrial cancer (only in the CE plus MPA substudy), colorectal cancer, hip fracture, or death due to other causes. These substudies did not evaluate the effects of CE plus MPA or CE-alone on menopausal symptoms.
WHI Estrogen Plus Progestin Substudy
The WHI estrogen plus progestin substudy was stopped early. According to the predefined stopping rule, after an average follow-up of 5.6 years of treatment, the increased risk of invasive breast cancer and cardiovascular events exceeded the specified benefits included in the "global index." The absolute excess risk of events included in the "global index" was 19 per 10,000 women-years.
For those outcomes included in the WHI "global index" that reached statistical significance after 5.6 years of follow-up, the absolute excess risks per 10,000 women-years in the group treated with CE plus MPA were 7 more CHD events, 8 more strokes, 10 more PEs, and 8 more invasive breast cancers, while the absolute risk reductions per 10,000 women-years were 6 fewer colorectal cancers and 5 fewer hip fractures.
Results of the CE plus MPA substudy, which included 16,608 women (average 63 years of age, range 50 to 79; 83.9 percent White, 6.8 percent Black, 5.4 percent Hispanic, 3.9 percent Other) are presented in Table 10. These results reflect centrally adjudicated data after an average follow-up of 5.6 years.
| Relative Risk CE/MPA vs. Placebo (95% nCI‡) | CE/MPA n = 8,506 | Placebo n = 8,102 | |
|---|---|---|---|
| Event | Absolute Risk per 10,000 Women-Years | ||
| |||
CHD events | 1.23 (0.99–1.53) | 41 | 34 |
Non-fatal MI | 1.28 (1.00–1.63) | 31 | 25 |
CHD death | 1.10 (0.70–1.75) | 8 | 8 |
All Strokes | 1.31 (1.03–1.68) | 33 | 25 |
Ischemic stroke | 1.44 (1.09–1.90) | 26 | 18 |
Deep vein thrombosis§ | 1.95 (1.43–2.67) | 26 | 13 |
Pulmonary embolism | 2.13 (1.45–3.11) | 18 | 8 |
Invasive breast cancer¶ | 1.24 (1.01–1.54) | 41 | 33 |
Colorectal cancer | 0.61 (0.42–0.87) | 10 | 16 |
Endometrial cancer§ | 0.81 (0.48–1.36) | 6 | 7 |
Cervical cancer§ | 1.44 (0.47–4.42) | 2 | 1 |
Hip fracture | 0.67 (0.47–0.96) | 11 | 16 |
Vertebral fractures§ | 0.65 (0.46–0.92) | 11 | 17 |
Lower arm/wrist fractures§ | 0.71 (0.59–0.85) | 44 | 62 |
Total fractures§ | 0.76 (0.69–0.83) | 152 | 199 |
Overall Mortality# | 1.00 (0.83–1.19) | 52 | 52 |
Global IndexÞ | 1.13 (1.02–1.25) | 184 | 165 |
Timing of the initiation of estrogen plus progestin therapy relative to the start of menopause may affect the overall risk benefit profile. The WHI estrogen plus progestin substudy stratified by age showed in women 50 to 59 years of age, a non-significant trend toward reduced risk for overall mortality [hazard ratio (HR) 0.69 (95 percent CI, 0.44–1.07)].
WHI Estrogen-Alone Substudy
The WHI estrogen-alone substudy was stopped early because an increased risk of stroke was observed, and it was deemed that no further information would be obtained regarding the risks and benefits of estrogen-alone in predetermined primary endpoints.
Results of the estrogen-alone substudy, which included 10,739 women (average 63 years of age, range 50 to 79; 75.3 percent White, 15.1 percent Black, 6.1 percent Hispanic, 3.6 percent Other) after an average follow-up of 7.1 years, are presented in Table 11.
| Relative Risk CE vs. Placebo (95% nCI†) | CE n = 5,310 | Placebo n = 5,429 | |
|---|---|---|---|
| Event | Absolute Risk per 10,000 Women-Years | ||
| |||
CHD events‡ | 0.95 (0.78–1.16) | 54 | 57 |
Non-fatal MI‡ | 0.91 (0.73–1.14) | 40 | 43 |
CHD death‡ | 1.01 (0.71–1.43) | 16 | 16 |
All Strokes‡ | 1.33 (1.05–1.68) | 45 | 33 |
Ischemic stroke‡ | 1.55 (1.19–2.01) | 38 | 25 |
1.47 (1.06–2.06) | 23 | 15 | |
Pulmonary embolism‡ | 1.37 (0.90–2.07) | 14 | 10 |
Invasive breast cancer‡ | 0.80 (0.62–1.04) | 28 | 34 |
Colorectal cancer¶ | 1.08 (0.75–1.55) | 17 | 16 |
Hip fracture‡ | 0.65 (0.45–0.94) | 12 | 19 |
0.64 (0.44–0.93) | 11 | 18 | |
0.58 (0.47–0.72) | 35 | 59 | |
0.71 (0.64–0.80) | 144 | 197 | |
1.08 (0.88–1.32) | 53 | 50 | |
1.04 (0.88–1.22) | 79 | 75 | |
Global IndexÞ | 1.02 (0.92–1.13) | 206 | 201 |
For those outcomes included in the WHI "global index" that reached statistical significance, the absolute excess risk per 10,000 women-years in the group treated with CE-alone was 12 more strokes while the absolute risk reduction per 10,000 women-years was 7 fewer hip fractures.9 The absolute excess risk of events included in the "global index" was a non-significant 5 events per 10,000 women-years. There was no difference between the groups in terms of all-cause mortality.
No overall difference for primary CHD events (nonfatal MI, silent MI and CHD death) and invasive breast cancer incidence in women receiving CE-alone compared with placebo was reported in final centrally adjudicated results from the estrogen-alone substudy, after an average follow up of 7.1 years.
Centrally adjudicated results for stroke events from the estrogen-alone substudy, after an average follow-up of 7.1 years, reported no significant difference in distribution of stroke subtype or severity, including fatal strokes, in women receiving CE-alone compared to placebo. Estrogen-alone increased the risk for ischemic stroke, and this excess risk was present in all subgroups of women examined.10
Timing of the initiation of estrogen-alone therapy relative to the start of menopause may affect the overall risk benefit profile. The WHI estrogen-alone substudy, stratified by age, showed in women 50 to 59 years of age a non-significant trend toward reduced risk for CHD [HR 0.63 (95 percent CI, 0.36–1.09)] and overall mortality [HR 0.71 (95 percent CI, 0.46–1.11)].
14.7 Women's Health Initiative Memory Study
The WHIMS estrogen plus progestin ancillary study of WHI enrolled 4,532 predominantly healthy postmenopausal women 65 years of age and older (47 percent were 65 to 69 years of age; 35 percent were 70 to 74 years of age; and 18 percent were 75 years of age and older) to evaluate the effects of daily CE (0.625 mg) plus MPA (2.5 mg) on the incidence of probable dementia (primary outcome) compared to placebo.
After an average follow-up of 4 years, the relative risk of probable dementia for CE plus MPA versus placebo was 2.05 (95 percent CI, 1.21–3.48). The absolute risk of probable dementia for CE plus MPA versus placebo was 45 versus 22 cases per 10,000 women-years. Probable dementia as defined in this study included Alzheimer's disease (AD), vascular dementia (VaD) and mixed types (having features of both AD and VaD). The most common classification of probable dementia in the treatment group and the placebo group was AD. Since the ancillary study was conducted in women 65 to 79 years of age, it is unknown whether these findings apply to younger postmenopausal women [see Warnings and Precautions (5.3), and Use in Specific Populations (8.5)].
The WHIMS estrogen-alone ancillary study of WHI enrolled 2,947 predominantly healthy hysterectomized postmenopausal women 65 to 79 years of age and older (45 percent were 65 to 69 years of age; 36 percent were 70 to 74 years of age; 19 percent were 75 years of age and older) to evaluate the effects of daily CE (0.625 mg)-alone on the incidence of probable dementia (primary outcome) compared to placebo.
After an average follow-up of 5.2 years, the relative risk of probable dementia for CE-alone versus placebo was 1.49 (95 percent CI, 0.83–2.66). The absolute risk of probable dementia for CE-alone versus placebo was 37 versus 25 cases per 10,000 women-years. Probable dementia as defined in this study included AD, VaD and mixed types (having features of both AD and VaD). The most common classification of probable dementia in the treatment group and the placebo group was AD. Since the ancillary study was conducted in women 65 to 79 years of age, it is unknown whether these findings apply to younger postmenopausal women [see Warnings and Precautions (5.3), and Use in Specific Populations (8.5)].
When data from the two populations were pooled as planned in the WHIMS protocol, the reported overall relative risk for probable dementia was 1.76 (95 percent CI, 1.19–2.60). Differences between groups became apparent in the first year of treatment. It is unknown whether these findings apply to younger postmenopausal women [see Warnings and Precautions (5.3), and Use in Specific Populations (8.5)].
Health Professional Information
{{section_name_patient}}
{{section_body_html_patient}}
Resources
Didn’t find what you were looking for? Contact us.
Chat online with Pfizer Medical Information regarding your inquiry on a Pfizer medicine.
*Speak with a Pfizer Medical Information Professional regarding your medical inquiry. Available 9AM-5Pm ET Monday to Friday; excluding holidays.
Submit a medical question for Pfizer prescription products.
Report Adverse Event
To report an adverse event related to the Pfizer-BioNTech COVID-19 Vaccine, and you are not part of a clinical trial* for this product, click the link below to submit your information:
Pfizer Safety Reporting Site*If you are involved in a clinical trial for this product, adverse events should be reported to your coordinating study site.
If you cannot use the above website, or would like to report an adverse event related to a different Pfizer product, please call Pfizer Safety at (800) 438-1985.
You may also contact the U.S. Food and Drug Administration (FDA) directly to report adverse events or product quality concerns either online at www.fda.gov/medwatch or call (800) 822-7967.