INLYTA® Clinical Studies
(axitinib)
14 CLINICAL STUDIES
14.1 First-Line Advanced RCC
INLYTA in Combination with Avelumab
The efficacy and safety of INLYTA in combination with avelumab was demonstrated in the JAVELIN Renal 101 trial (NCT02684006), a randomized, multicenter, open-label, study of INLYTA in combination with avelumab in 886 patients with untreated advanced RCC regardless of tumor PD-L1 expression [intent-to-treat (ITT) population]. Patients with autoimmune disease or conditions requiring systemic immunosuppression were excluded.
Randomization was stratified according to Eastern Cooperative Oncology Group (ECOG) Performance Status (PS) (0 vs. 1) and region (United States vs. Canada/Western Europe vs. the rest of the world). Patients were randomized (1:1) to one of the following treatment arms:
- INLYTA 5 mg twice daily orally was given in combination with avelumab 10 mg/kg intravenous infusion every 2 weeks (N=442). Patients who tolerated INLYTA 5 mg twice daily without Grade 2 or greater INLYTA-related adverse events for 2 consecutive weeks could increase to 7 mg and then subsequently to 10 mg twice daily. INLYTA could be interrupted or reduced to 3 mg twice daily and subsequently to 2 mg twice daily to manage toxicity.
- Sunitinib 50 mg once daily orally for 4 weeks followed by 2 weeks off (N=444) until radiographic or clinical progression or unacceptable toxicity.
Treatment with INLYTA and avelumab continued until RECIST v1.1-defined progression of disease by Blinded Independent Central Review (BICR) assessment or unacceptable toxicity. Administration of INLYTA and avelumab was permitted beyond RECIST-defined disease progression if the patient was clinically stable and considered to be deriving clinical benefit by the investigator. Assessment of tumor status was performed at baseline, after randomization at 6 weeks, then every 6 weeks thereafter up to 18 months after randomization, and every 12 weeks thereafter until documented confirmed disease progression by BICR.
Baseline characteristics were a median age of 61 years (range: 27 to 88), 38% of patients were 65 years or older, 75% were male, 75% were White, and the ECOG PS was 0 (63%) or 1 (37%), respectively. Patient distribution by International Metastatic Renal Cell Carcinoma Database (IMDC) risk groups was 21% favorable, 62% intermediate, and 16% poor.
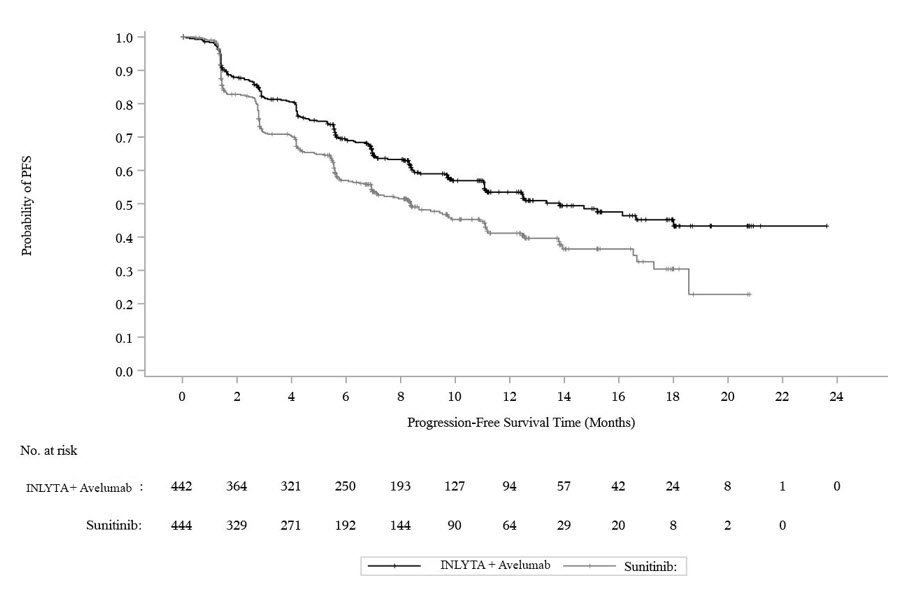
The major efficacy outcome measures were progression-free survival (PFS), as assessed by an BICR using RECIST v1.1 and overall survival (OS) in patients with PD-L1-positive tumors using a clinical trial assay (PD-L1 expression level ≥1%). Since PFS was statistically significant in patients with PD-L1-positive tumors [HR 0.61 (95% CI: 0.48, 0.79)], it was then tested in the ITT population and a statistically significant improvement in PFS in the ITT population was also demonstrated.
With a median overall survival follow-up of 19 months, overall survival data were immature with 27% deaths in the ITT population.
Efficacy results are presented in Table 10 and Figure 2.
| Efficacy Endpoints (Based on BICR Assessment) | INLYTA plus avelumab (N=422) | Sunitinib (N=444) |
|---|---|---|
| BICR: Blinded Independent Central Review; CI: Confidence interval; NE: Not estimable. | ||
| ||
| Progression-Free Survival (PFS) | ||
| Events (%) | 180 (41) | 216 (49) |
| Median in Months (95% CI) | 13.8 (11.1, NE) | 8.4 (6.9, 11.1) |
| Hazard ratio (95% CI) | 0.69 (0.56, 0.84) | |
| 2-sided p-value* | 0.0002 | |
| Confirmed Objective Response Rate (ORR) | ||
| Objective Response Rate n (%) | 227 (51.4) | 114 (25.7) |
| (95% CI) | (46.6, 56.1) | (21.7, 30.0) |
| Complete Response (CR) n (%) | 15 (3.4) | 8 (1.8) |
| Partial Response (PR) n (%) | 212 (48) | 106 (24) |
Figure 2. K-M Estimates for PFS Based on BICR Assessment - ITT
INLYTA in Combination with Pembrolizumab
The efficacy of INLYTA in combination with pembrolizumab was investigated in KEYNOTE-426 (NCT02853331), a randomized, multicenter, open-label trial conducted in 861 patients who had not received systemic therapy for advanced RCC. Patients were enrolled regardless of PD-L1 tumor expression status. Patients with active autoimmune disease requiring systemic immunosuppression within the last 2 years were ineligible. Randomization was stratified by International Metastatic RCC Database Consortium (IMDC) risk categories (favorable versus intermediate versus poor) and geographic region (North America versus Western Europe versus "Rest of the World").
Patients were randomized (1:1) to one of the following treatment arms:
- INLYTA 5 mg orally, twice daily in combination with pembrolizumab 200 mg intravenously every 3 weeks up to 24 months. Patients who tolerated INLYTA 5 mg twice daily for 2 consecutive cycles (6 weeks) could increase to 7 mg and then subsequently to 10 mg twice daily. INLYTA could be interrupted or reduced to 3 mg twice daily and subsequently to 2 mg twice daily to manage toxicity.
- Sunitinib 50 mg orally, once daily for 4 weeks and then off treatment for 2 weeks.
Treatment with INLYTA and pembrolizumab continued until RECIST v1.1-defined progression of disease or unacceptable toxicity. Administration of INLYTA and pembrolizumab was permitted beyond RECIST-defined disease progression if the patient was clinically stable and considered to be deriving clinical benefit by the investigator. Assessment of tumor status was performed at baseline, after randomization at Week 12, then every 6 weeks thereafter until Week 54, and then every 12 weeks thereafter.
The study population characteristics were: median age of 62 years (range: 26 to 90); 38% age 65 or older; 73% male; 79% White and 16% Asian; 20% and 80% of patients had a baseline KPS of 70 to 80 and 90 to 100, respectively; and patient distribution by IMDC risk categories was 31% favorable, 56% intermediate and 13% poor.
The main efficacy outcome measures were OS and PFS as assessed by BICR according to RECIST v1.1, modified to follow a maximum of 10 target lesions and a maximum of 5 target lesions per organ. Additional efficacy outcome measures included ORR, as assessed by BICR. A statistically significant improvement in OS was demonstrated at the first pre-specified interim analysis in patients randomized to INLYTA in combination with pembrolizumab compared with sunitinib. The trial also demonstrated statistically significant improvements in PFS and ORR.
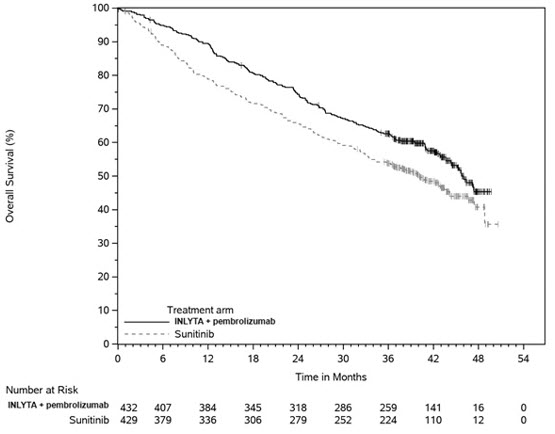
An updated OS analysis was conducted when 418 deaths were observed based on the planned number of deaths for the pre-specified final analysis. Table 11 and Figure 3 summarize the efficacy results for KEYNOTE-426.
| Endpoint | INLYTA and Pembrolizumab N=432 | Sunitinib N=429 |
|---|---|---|
| CI: confidence interval; NR: not reached; ORR: objective response rate; OS: overall survival; PFS: progression-free survival. | ||
| ||
| OS | ||
| Number of patients with event (%) | 59 (14%) | 97 (23%) |
| Median in months (95% CI) | NR (NR, NR) | NR (NR, NR) |
| Hazard ratio* (95% CI) | 0.53 (0.38, 0.74) | |
| p-Value † | <0.0001 ‡ | |
| 12-month OS rate | 90% (86, 92) | 78% (74, 82) |
| Updated OS | ||
| Number of patients with event (%) | 193 (45%) | 225 (52%) |
| Median in months (95% CI) | 45.7 (43.6, NR) | 40.1 (34.3, 44.2) |
| Hazard ratio* (95% CI) | 0.73 (0.60, 0.88) | |
| PFS | ||
| Number of patients with event (%) | 183 (42%) | 213 (50%) |
| Median in months (95% CI) | 15.1 (12.6, 17.7) | 11.0 (8.7, 12.5) |
| Hazard ratio* (95% CI) | 0.69 (0.56, 0.84) | |
| p-Value † | 0.0001§ | |
| ORR | ||
| Overall confirmed response rate (95% CI) | 59% (54, 64) | 36% (31, 40) |
| Complete response rate | 6% | 2% |
| Partial response rate | 53% | 34% |
| p-Value¶ | <0.0001 | |
Figure 3. Kaplan-Meier Curve for Overall Survival in KEYNOTE-426
In an exploratory analysis, the updated analysis of OS in patients with IMDC favorable, intermediate, intermediate/poor, and poor risk demonstrated a HR of 1.17 (95% CI: 0.76, 1.80), 0.67 (95% CI: 0.52, 0.86), 0.64 (95% CI: 0.52, 0.80), and 0.51 (95% CI: 0.32, 0.81), respectively.
14.2 Second-Line Advanced RCC
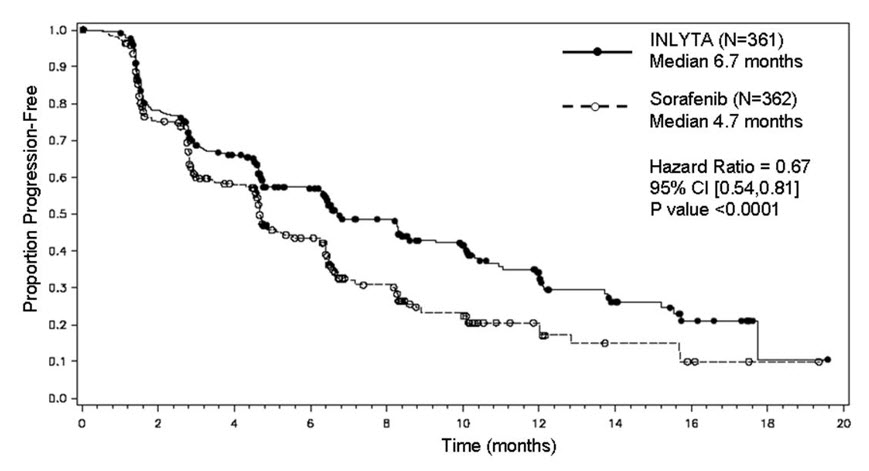
The safety and efficacy of INLYTA were evaluated in a randomized, open-label, multicenter Phase 3 study. Patients (N=723) with advanced RCC whose disease had progressed on or after treatment with 1 prior systemic therapy, including sunitinib-, bevacizumab-, temsirolimus-, or cytokine-containing regimens were randomized (1:1) to receive INLYTA (N=361) or sorafenib (N=362). Progression-free survival (PFS) was assessed by a blinded independent central review committee. Other endpoints included objective response rate (ORR) and overall survival (OS).
Of the patients enrolled in this study, 389 patients (54%) had received 1 prior sunitinib-based therapy, 251 patients (35%) had received 1 prior cytokine-based therapy (interleukin-2 or interferon-alfa), 59 patients (8%) had received 1 prior bevacizumab-based therapy, and 24 patients (3%) had received 1 prior temsirolimus-based therapy. The baseline demographic and disease characteristics were similar between the INLYTA and sorafenib groups with regard to age (median 61 years), gender (72% male), race (75% white, 21% Asian), Eastern Cooperative Oncology Group (ECOG) performance status (55% 0, 45% 1), and histology (99% clear cell).
There was a statistically significant advantage for INLYTA over sorafenib for the endpoint of PFS (see Table 12 and Figure 4). There was no statistically significant difference between the arms in OS.
| Endpoint/Study Population | INLYTA | Sorafenib | HR (95% CI) | P-value |
|---|---|---|---|---|
| CI: Confidence interval; HR: Hazard ratio (INLYTA/sorafenib); ITT: Intent-to-treat; ORR: Objective response rate; NS: Not significant; OS: Overall survival; PFS: Progression-free survival | ||||
| ||||
| Overall ITT | N= 361 | N = 362 | ||
| Median PFS*,† in months (95% CI) | 6.7 (6.3, 8.6) | 4.7 (4.6, 5.6) | 0.67 (0.54, 0.81) | <0.0001‡ |
| Median OS in months (95% CI) | 20.1 (16.7, 23.4) | 19.2 (17.5, 22.3) | 0.97 (0.80, 1.17) | NS |
| ORR % (95% CI) | 19.4 (15.4, 23.9) | 9.4 (6.6, 12.9) | 2.06§ (1.41, 3.00) | -¶ |
| PFS by prior treatment | ||||
| Sunitinib-refractory subgroup | N=194 | N=195 | ||
| Median, months (95% CI) | 4.8 (4.5, 6.4) | 3.4 (2.8, 4.7) | 0.74 (0.57, 0.96) | -¶ |
| Cytokine-refractory subgroup | N=126 | N=125 | ||
| Median, months (95% CI) | 12.1 (10.1, 13.9) | 6.5 (6.3, 8.3) | 0.46 (0.32, 0.68) | -¶ |
Figure 4. Kaplan-Meier Curve for Progression-Free Survival by Independent Assessment (Intent-to-Treat Population)
Find INLYTA® medical information:
Find INLYTA® medical information:
INLYTA® Quick Finder
Health Professional Information
Clinical Studies
14 CLINICAL STUDIES
14.1 First-Line Advanced RCC
INLYTA in Combination with Avelumab
The efficacy and safety of INLYTA in combination with avelumab was demonstrated in the JAVELIN Renal 101 trial (NCT02684006), a randomized, multicenter, open-label, study of INLYTA in combination with avelumab in 886 patients with untreated advanced RCC regardless of tumor PD-L1 expression [intent-to-treat (ITT) population]. Patients with autoimmune disease or conditions requiring systemic immunosuppression were excluded.
Randomization was stratified according to Eastern Cooperative Oncology Group (ECOG) Performance Status (PS) (0 vs. 1) and region (United States vs. Canada/Western Europe vs. the rest of the world). Patients were randomized (1:1) to one of the following treatment arms:
- INLYTA 5 mg twice daily orally was given in combination with avelumab 10 mg/kg intravenous infusion every 2 weeks (N=442). Patients who tolerated INLYTA 5 mg twice daily without Grade 2 or greater INLYTA-related adverse events for 2 consecutive weeks could increase to 7 mg and then subsequently to 10 mg twice daily. INLYTA could be interrupted or reduced to 3 mg twice daily and subsequently to 2 mg twice daily to manage toxicity.
- Sunitinib 50 mg once daily orally for 4 weeks followed by 2 weeks off (N=444) until radiographic or clinical progression or unacceptable toxicity.
Treatment with INLYTA and avelumab continued until RECIST v1.1-defined progression of disease by Blinded Independent Central Review (BICR) assessment or unacceptable toxicity. Administration of INLYTA and avelumab was permitted beyond RECIST-defined disease progression if the patient was clinically stable and considered to be deriving clinical benefit by the investigator. Assessment of tumor status was performed at baseline, after randomization at 6 weeks, then every 6 weeks thereafter up to 18 months after randomization, and every 12 weeks thereafter until documented confirmed disease progression by BICR.
Baseline characteristics were a median age of 61 years (range: 27 to 88), 38% of patients were 65 years or older, 75% were male, 75% were White, and the ECOG PS was 0 (63%) or 1 (37%), respectively. Patient distribution by International Metastatic Renal Cell Carcinoma Database (IMDC) risk groups was 21% favorable, 62% intermediate, and 16% poor.
The major efficacy outcome measures were progression-free survival (PFS), as assessed by an BICR using RECIST v1.1 and overall survival (OS) in patients with PD-L1-positive tumors using a clinical trial assay (PD-L1 expression level ≥1%). Since PFS was statistically significant in patients with PD-L1-positive tumors [HR 0.61 (95% CI: 0.48, 0.79)], it was then tested in the ITT population and a statistically significant improvement in PFS in the ITT population was also demonstrated.
With a median overall survival follow-up of 19 months, overall survival data were immature with 27% deaths in the ITT population.
Efficacy results are presented in Table 10 and Figure 2.
| Efficacy Endpoints (Based on BICR Assessment) | INLYTA plus avelumab (N=422) | Sunitinib (N=444) |
|---|---|---|
| BICR: Blinded Independent Central Review; CI: Confidence interval; NE: Not estimable. | ||
| ||
| Progression-Free Survival (PFS) | ||
| Events (%) | 180 (41) | 216 (49) |
| Median in Months (95% CI) | 13.8 (11.1, NE) | 8.4 (6.9, 11.1) |
| Hazard ratio (95% CI) | 0.69 (0.56, 0.84) | |
| 2-sided p-value* | 0.0002 | |
| Confirmed Objective Response Rate (ORR) | ||
| Objective Response Rate n (%) | 227 (51.4) | 114 (25.7) |
| (95% CI) | (46.6, 56.1) | (21.7, 30.0) |
| Complete Response (CR) n (%) | 15 (3.4) | 8 (1.8) |
| Partial Response (PR) n (%) | 212 (48) | 106 (24) |
Figure 2. K-M Estimates for PFS Based on BICR Assessment - ITT
INLYTA in Combination with Pembrolizumab
The efficacy of INLYTA in combination with pembrolizumab was investigated in KEYNOTE-426 (NCT02853331), a randomized, multicenter, open-label trial conducted in 861 patients who had not received systemic therapy for advanced RCC. Patients were enrolled regardless of PD-L1 tumor expression status. Patients with active autoimmune disease requiring systemic immunosuppression within the last 2 years were ineligible. Randomization was stratified by International Metastatic RCC Database Consortium (IMDC) risk categories (favorable versus intermediate versus poor) and geographic region (North America versus Western Europe versus "Rest of the World").
Patients were randomized (1:1) to one of the following treatment arms:
- INLYTA 5 mg orally, twice daily in combination with pembrolizumab 200 mg intravenously every 3 weeks up to 24 months. Patients who tolerated INLYTA 5 mg twice daily for 2 consecutive cycles (6 weeks) could increase to 7 mg and then subsequently to 10 mg twice daily. INLYTA could be interrupted or reduced to 3 mg twice daily and subsequently to 2 mg twice daily to manage toxicity.
- Sunitinib 50 mg orally, once daily for 4 weeks and then off treatment for 2 weeks.
Treatment with INLYTA and pembrolizumab continued until RECIST v1.1-defined progression of disease or unacceptable toxicity. Administration of INLYTA and pembrolizumab was permitted beyond RECIST-defined disease progression if the patient was clinically stable and considered to be deriving clinical benefit by the investigator. Assessment of tumor status was performed at baseline, after randomization at Week 12, then every 6 weeks thereafter until Week 54, and then every 12 weeks thereafter.
The study population characteristics were: median age of 62 years (range: 26 to 90); 38% age 65 or older; 73% male; 79% White and 16% Asian; 20% and 80% of patients had a baseline KPS of 70 to 80 and 90 to 100, respectively; and patient distribution by IMDC risk categories was 31% favorable, 56% intermediate and 13% poor.
The main efficacy outcome measures were OS and PFS as assessed by BICR according to RECIST v1.1, modified to follow a maximum of 10 target lesions and a maximum of 5 target lesions per organ. Additional efficacy outcome measures included ORR, as assessed by BICR. A statistically significant improvement in OS was demonstrated at the first pre-specified interim analysis in patients randomized to INLYTA in combination with pembrolizumab compared with sunitinib. The trial also demonstrated statistically significant improvements in PFS and ORR.
An updated OS analysis was conducted when 418 deaths were observed based on the planned number of deaths for the pre-specified final analysis. Table 11 and Figure 3 summarize the efficacy results for KEYNOTE-426.
| Endpoint | INLYTA and Pembrolizumab N=432 | Sunitinib N=429 |
|---|---|---|
| CI: confidence interval; NR: not reached; ORR: objective response rate; OS: overall survival; PFS: progression-free survival. | ||
| ||
| OS | ||
| Number of patients with event (%) | 59 (14%) | 97 (23%) |
| Median in months (95% CI) | NR (NR, NR) | NR (NR, NR) |
| Hazard ratio* (95% CI) | 0.53 (0.38, 0.74) | |
| p-Value † | <0.0001 ‡ | |
| 12-month OS rate | 90% (86, 92) | 78% (74, 82) |
| Updated OS | ||
| Number of patients with event (%) | 193 (45%) | 225 (52%) |
| Median in months (95% CI) | 45.7 (43.6, NR) | 40.1 (34.3, 44.2) |
| Hazard ratio* (95% CI) | 0.73 (0.60, 0.88) | |
| PFS | ||
| Number of patients with event (%) | 183 (42%) | 213 (50%) |
| Median in months (95% CI) | 15.1 (12.6, 17.7) | 11.0 (8.7, 12.5) |
| Hazard ratio* (95% CI) | 0.69 (0.56, 0.84) | |
| p-Value † | 0.0001§ | |
| ORR | ||
| Overall confirmed response rate (95% CI) | 59% (54, 64) | 36% (31, 40) |
| Complete response rate | 6% | 2% |
| Partial response rate | 53% | 34% |
| p-Value¶ | <0.0001 | |
Figure 3. Kaplan-Meier Curve for Overall Survival in KEYNOTE-426
In an exploratory analysis, the updated analysis of OS in patients with IMDC favorable, intermediate, intermediate/poor, and poor risk demonstrated a HR of 1.17 (95% CI: 0.76, 1.80), 0.67 (95% CI: 0.52, 0.86), 0.64 (95% CI: 0.52, 0.80), and 0.51 (95% CI: 0.32, 0.81), respectively.
14.2 Second-Line Advanced RCC
The safety and efficacy of INLYTA were evaluated in a randomized, open-label, multicenter Phase 3 study. Patients (N=723) with advanced RCC whose disease had progressed on or after treatment with 1 prior systemic therapy, including sunitinib-, bevacizumab-, temsirolimus-, or cytokine-containing regimens were randomized (1:1) to receive INLYTA (N=361) or sorafenib (N=362). Progression-free survival (PFS) was assessed by a blinded independent central review committee. Other endpoints included objective response rate (ORR) and overall survival (OS).
Of the patients enrolled in this study, 389 patients (54%) had received 1 prior sunitinib-based therapy, 251 patients (35%) had received 1 prior cytokine-based therapy (interleukin-2 or interferon-alfa), 59 patients (8%) had received 1 prior bevacizumab-based therapy, and 24 patients (3%) had received 1 prior temsirolimus-based therapy. The baseline demographic and disease characteristics were similar between the INLYTA and sorafenib groups with regard to age (median 61 years), gender (72% male), race (75% white, 21% Asian), Eastern Cooperative Oncology Group (ECOG) performance status (55% 0, 45% 1), and histology (99% clear cell).
There was a statistically significant advantage for INLYTA over sorafenib for the endpoint of PFS (see Table 12 and Figure 4). There was no statistically significant difference between the arms in OS.
| Endpoint/Study Population | INLYTA | Sorafenib | HR (95% CI) | P-value |
|---|---|---|---|---|
| CI: Confidence interval; HR: Hazard ratio (INLYTA/sorafenib); ITT: Intent-to-treat; ORR: Objective response rate; NS: Not significant; OS: Overall survival; PFS: Progression-free survival | ||||
| ||||
| Overall ITT | N= 361 | N = 362 | ||
| Median PFS*,† in months (95% CI) | 6.7 (6.3, 8.6) | 4.7 (4.6, 5.6) | 0.67 (0.54, 0.81) | <0.0001‡ |
| Median OS in months (95% CI) | 20.1 (16.7, 23.4) | 19.2 (17.5, 22.3) | 0.97 (0.80, 1.17) | NS |
| ORR % (95% CI) | 19.4 (15.4, 23.9) | 9.4 (6.6, 12.9) | 2.06§ (1.41, 3.00) | -¶ |
| PFS by prior treatment | ||||
| Sunitinib-refractory subgroup | N=194 | N=195 | ||
| Median, months (95% CI) | 4.8 (4.5, 6.4) | 3.4 (2.8, 4.7) | 0.74 (0.57, 0.96) | -¶ |
| Cytokine-refractory subgroup | N=126 | N=125 | ||
| Median, months (95% CI) | 12.1 (10.1, 13.9) | 6.5 (6.3, 8.3) | 0.46 (0.32, 0.68) | -¶ |
Figure 4. Kaplan-Meier Curve for Progression-Free Survival by Independent Assessment (Intent-to-Treat Population)
Resources
Didn’t find what you were looking for? Contact us.
Chat online with Pfizer Medical Information regarding your inquiry on a Pfizer medicine.
*Contact Medical Information.9AM-5PM ET Monday to Friday; excluding holidays.
Report Adverse Event
To report an adverse event related to the Pfizer-BioNTech COVID-19 Vaccine, and you are not part of a clinical trial* for this product, click the link below to submit your information:
Pfizer Safety Reporting Site*If you are involved in a clinical trial for this product, adverse events should be reported to your coordinating study site.
If you cannot use the above website, or would like to report an adverse event related to a different Pfizer product, please call Pfizer Safety at (800) 438-1985.
You may also contact the U.S. Food and Drug Administration (FDA) directly to report adverse events or product quality concerns either online at www.fda.gov/medwatch or call (800) 822-7967.