CAMPTOSAR® Clinical Studies
(irinotecan HCl)
14 CLINICAL STUDIES
Irinotecan has been studied in clinical trials in combination with 5-fluorouracil (5-FU) and leucovorin (LV) and as a single agent [see Dosage and Administration (2)]. When given as a component of combination-agent treatment, irinotecan was either given with a weekly schedule of bolus 5-FU/LV or with an every-2-week schedule of infusional 5-FU/LV. Weekly and once-every-3-week dosage schedules were used for the single-agent irinotecan studies. Clinical studies of combination and single-agent use are described below.
14.1 Metastatic Colorectal Cancer
First-Line Therapy in Combination with 5-FU/LV: Studies 1 and 2
Two phase 3, randomized, controlled, multinational clinical trials support the use of CAMPTOSAR Injection as first-line treatment of patients with metastatic carcinoma of the colon or rectum. In each study, combinations of irinotecan with 5-FU and LV were compared with 5-FU and LV alone. Study 1 compared combination irinotecan/bolus 5-FU/LV therapy given weekly with a standard bolus regimen of 5-FU/LV alone given daily for 5 days every 4 weeks; an irinotecan-alone treatment arm given on a weekly schedule was also included. Study 2 evaluated two different methods of administering infusional 5-FU/LV, with or without irinotecan. In both studies, concomitant medications such as antiemetics, atropine, and loperamide were given to patients for prophylaxis and/or management of symptoms from treatment. In Study 2, a 7-day course of fluoroquinolone antibiotic prophylaxis was given in patients whose diarrhea persisted for greater than 24 hours despite loperamide or if they developed a fever in addition to diarrhea. Treatment with oral fluoroquinolone was also initiated in patients who developed an absolute neutrophil count (ANC) <500/mm3, even in the absence of fever or diarrhea. Patients in both studies also received treatment with intravenous antibiotics if they had persistent diarrhea or fever or if ileus developed.
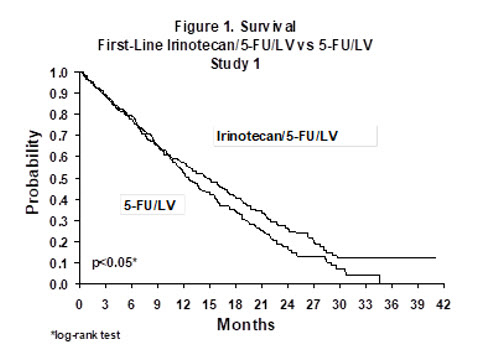
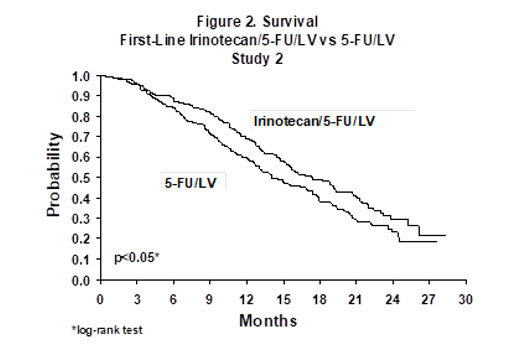
In both studies, the combination of irinotecan/5-FU/LV therapy resulted in significant improvements in objective tumor response rates, time to tumor progression, and survival when compared with 5-FU/LV alone. These differences in survival were observed in spite of second-line therapy in a majority of patients on both arms, including crossover to irinotecan-containing regimens in the control arm. Patient characteristics and major efficacy results are shown in Table 10.
| Study 1 | Study 2 | ||||
|---|---|---|---|---|---|
| Irinotecan + Bolus 5-FU/LV weekly × 4 every 6 weeks | Bolus 5-FU/LV daily × 5 every 4 weeks | Irinotecan weekly × 4 every 6 weeks | Irinotecan + Infusional 5-FU/LV | Infusional 5-FU/LV | |
| Number of patients | 231 | 226 | 226 | 198 | 187 |
| Demographics and treatment administration | |||||
| Female/Male (%) | 34/65 | 45/54 | 35/64 | 33/67 | 47/53 |
| Median age in years (range) | 62 (25–85) | 61 (19–85) | 61 (30–87) | 62 (27–75) | 59 (24–75) |
| Performance status (%) | |||||
| 0 | 39 | 41 | 46 | 51 | 51 |
| 1 | 46 | 45 | 46 | 42 | 41 |
| 2 | 15 | 13 | 8 | 7 | 8 |
| Primary tumor (%) | |||||
| Colon | 81 | 85 | 84 | 55 | 65 |
| Rectum | 17 | 14 | 15 | 45 | 35 |
| Median time from diagnosis to randomization (months, range) | 1.9 (0–161) | 1.7 (0–203) | 1.8 (0.1–185) | 4.5 (0–88) | 2.7 (0–104) |
| Prior adjuvant 5-FU therapy (%) No Yes | 89 11 | 92 8 | 90 10 | 74 26 | 76 24 |
| Median duration of study treatment* (months) | 5.5 | 4.1 | 3.9 | 5.6 | 4.5 |
| Median Relative Dose Intensity (%)* Irinotecan 5-FU | 72 71 | — 86 | 75 — | 87 86 | — 93 |
| Efficacy Results | |||||
| Confirmed objective tumor response rate† (%) | 39 | 21 | 18 | 35 | 22 |
| (p<0.0001)‡ | (p<0.005)‡ | ||||
| Median time to tumor progression§ (months) | 7.0 | 4.3 | 4.2 | 6.7 | 4.4 |
| (p=0.004)§ | (p<0.001)§ | ||||
| Median survival (months) | 14.8 | 12.6 | 12.0 | 17.4 | 14.1 |
| (p<0.05)§ | (p<0.05)§ | ||||
Improvement was noted with irinotecan-based combination therapy relative to 5-FU/LV when response rates and time to tumor progression were examined across the following demographic and disease-related subgroups (age, gender, ethnic origin, performance status, extent of organ involvement with cancer, time from diagnosis of cancer, prior adjuvant therapy, and baseline laboratory abnormalities). Figures 1 and 2 illustrate the Kaplan-Meier survival curves for the comparison of irinotecan/5-FU/LV versus 5-FU/LV in Studies 1 and 2, respectively.
Second-Line Therapy After 5-FU-Based Treatment
4 Weekly Doses on a 6-Week Cycle: Studies 3, 4, and 5
Data from three open-label, single-agent, clinical studies, involving a total of 304 patients in 59 centers, support the use of CAMPTOSAR in the treatment of patients with metastatic cancer of the colon or rectum that has recurred or progressed following treatment with 5-FU-based therapy. These studies were designed to evaluate tumor response rate and do not provide information on effects on survival and disease-related symptoms. In each study, CAMPTOSAR was administered in repeated 6-week cycles consisting of a 90-minute intravenous infusion once weekly for 4 weeks, followed by a 2-week rest period. Starting doses of CAMPTOSAR in these trials were 100, 125, or 150 mg/m2, but the 150-mg/m2 dose was poorly tolerated (due to high rates of grade 4 late diarrhea and febrile neutropenia). Study 3 enrolled 48 patients and was conducted by a single investigator at several regional hospitals. Study 4 was a multicenter study conducted by the North Central Cancer Treatment Group. All 90 patients enrolled in Study 4 received a starting dose of 125 mg/m2. Study 5 was a multicenter study that enrolled 166 patients from 30 institutions. The initial dose in Study 5 was 125 mg/m2 but was reduced to 100 mg/m2 because the toxicity seen at the 125-mg/m2 dose was perceived to be greater than that seen in previous studies. All patients in these studies had metastatic colorectal cancer, and the majority had disease that recurred or progressed following a 5-FU-based regimen administered for metastatic disease. The results of the individual studies are shown in Table 11.
| Study | ||||
|---|---|---|---|---|
| 3 | 4 | 5 | ||
| ||||
| Number of Patients | 48 | 90 | 64 | 102 |
| Starting Dose (mg/m2/week × 4) | 125* | 125 | 125 | 100 |
| Demographics and Treatment Administration | ||||
| Female/Male (%) | 46/54 | 36/64 | 50/50 | 51/49 |
| Median Age in years (range) | 63 (29–78) | 63 (32–81) | 61 (42–84) | 64 (25–84) |
| Ethnic Origin (%) | ||||
| White | 79 | 96 | 81 | 91 |
| African American | 12 | 4 | 11 | 5 |
| Hispanic | 8 | 0 | 8 | 2 |
| Oriental/Asian | 0 | 0 | 0 | 2 |
| Performance Status (%) | ||||
| 0 | 60 | 38 | 59 | 44 |
| 1 | 38 | 48 | 33 | 51 |
| 2 | 2 | 14 | 8 | 5 |
| Primary Tumor (%) | ||||
| Colon | 100 | 71 | 89 | 87 |
| Rectum | 0 | 29 | 11 | 8 |
| Unknown | 0 | 0 | 0 | 5 |
| Prior 5-FU Therapy (%) | ||||
| For Metastatic Disease | 81 | 66 | 73 | 68 |
| ≤ 6 months after Adjuvant | 15 | 7 | 27 | 28 |
| > 6 months after Adjuvant | 2 | 16 | 0 | 2 |
| Classification Unknown | 2 | 12 | 0 | 3 |
| Prior Pelvic/Abdominal Irradiation (%) | ||||
| Yes | 3 | 29 | 0 | 0 |
| Other | 0 | 9 | 2 | 4 |
| None | 97 | 62 | 98 | 96 |
| Duration of Treatment with CAMPTOSAR (median, months) | 5 | 4 | 4 | 3 |
| Relative Dose Intensity† (median %) | 74 | 67 | 73 | 81 |
| Efficacy | ||||
| Confirmed Objective Response Rate (%)‡ (95% CI) | 21 (9.3 – 32.3) | 13 (6.3 – 20.4) | 14 (5.5 – 22.6) | 9 (3.3 – 14.3) |
| Time to Response (median, months) | 2.6 | 1.5 | 2.8 | 2.8 |
| Response Duration (median, months) | 6.4 | 5.9 | 5.6 | 6.4 |
| Survival (median, months) | 10.4 | 8.1 | 10.7 | 9.3 |
| 1-Year Survival (%) | 46 | 31 | 45 | 43 |
In the intent-to-treat analysis of the pooled data across all three studies, 193 of the 304 patients began therapy at the recommended starting dose of 125 mg/m2. Among these 193 patients, 2 complete and 27 partial responses were observed, for an overall response rate of 15.0% (95% Confidence Interval [CI], 10.0% to 20.1%) at this starting dose. A considerably lower response rate was seen with a starting dose of 100 mg/m2. The majority of responses were observed within the first two cycles of therapy, but responses did occur in later cycles of treatment (one response was observed after the eighth cycle). The median response duration for patients beginning therapy at 125 mg/m2 was 5.8 months (range, 2.6 to 15.1 months). Of the 304 patients treated in the three studies, response rates to CAMPTOSAR were similar in males and females and among patients older and younger than 65 years. Rates were also similar in patients with cancer of the colon or cancer of the rectum and in patients with single and multiple metastatic sites. The response rate was 18.5% in patients with a performance status of 0 and 8.2% in patients with a performance status of 1 or 2. Patients with a performance status of 3 or 4 have not been studied. Over half of the patients responding to CAMPTOSAR had not responded to prior 5-FU. Patients who had received previous irradiation to the pelvis responded to CAMPTOSAR at approximately the same rate as those who had not previously received irradiation.
Once-Every-3-Week Dosage Schedule
Single Arm Study: Study 6
Data from an open-label, single-agent, single-arm, multicenter, clinical study involving a total of 132 patients support a once every-3-week dosage schedule of irinotecan in the treatment of patients with metastatic cancer of the colon or rectum that recurred or progressed following treatment with 5-FU. Patients received a starting dose of 350 mg/m2 given by 30-minute intravenous infusion once every 3 weeks. Among the 132 previously treated patients in this trial, the intent-to-treat response rate was 12.1% (95% CI, 7.0% to 18.1%).
Randomized Studies: Studies 7 and 8
Two multicenter, randomized, clinical studies further support the use of irinotecan given by the once-every-3-week dosage schedule in patients with metastatic colorectal cancer whose disease has recurred or progressed following prior 5-FU therapy. In Study 7, second-line irinotecan therapy plus best supportive care was compared with best supportive care alone. In Study 8, second-line irinotecan therapy was compared with infusional 5-FU-based therapy. In both studies, irinotecan was administered intravenously at a starting dose of 350 mg/m2 over 90 minutes once every 3 weeks. The starting dose was 300 mg/m2 for patients who were 70 years and older or who had a performance status of 2. The highest total dose permitted was 700 mg. Dose reductions and/or administration delays were permitted in the event of severe hematologic and/or nonhematologic toxicities while on treatment. Best supportive care was provided to patients in both arms of Study 7 and included antibiotics, analgesics, corticosteroids, transfusions, psychotherapy, or any other symptomatic therapy as clinically indicated. In both studies, concomitant medications such as antiemetics, atropine, and loperamide were given to patients for prophylaxis and/or management of symptoms from treatment. If late diarrhea persisted for greater than 24 hours despite loperamide, a 7-day course of fluoroquinolone antibiotic prophylaxis was given. Patients in the control arm of the Study 8 received one of the following 5-FU regimens: (1) LV, 200 mg/m2 IV over 2 hours; followed by 5-FU, 400 mg/m2 IV bolus; followed by 5-FU, 600 mg/m2 continuous IV infusion over 22 hours on days 1 and 2 every 2 weeks; (2) 5-FU, 250 to 300 mg/m2/day protracted continuous IV infusion until toxicity; (3) 5-FU, 2.6 to 3 g/m2 IV over 24 hours every week for 6 weeks with or without LV, 20 to 500 mg/m2/day every week IV for 6 weeks with 2-week rest between cycles. Patients were to be followed every 3 to 6 weeks for 1 year.
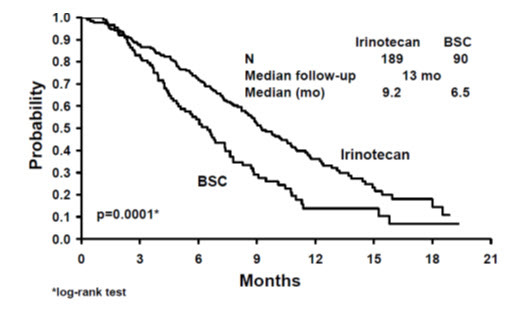
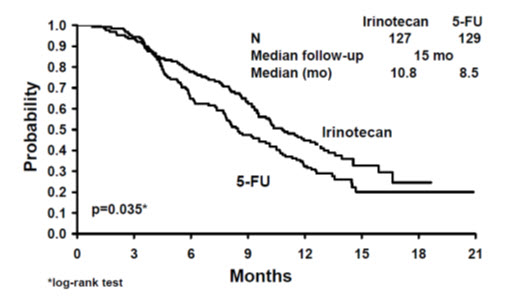
A total of 535 patients were randomized in the two studies at 94 centers. The primary endpoint in both studies was survival. The studies demonstrated a significant overall survival advantage for irinotecan compared with best supportive care (p=0.0001) and infusional 5-FU-based therapy (p=0.035) as shown in Figures 3 and 4. In Study 7, median survival for patients treated with irinotecan was 9.2 months compared with 6.5 months for patients receiving best supportive care. In Study 8, median survival for patients treated with irinotecan was 10.8 months compared with 8.5 months for patients receiving infusional 5-FU-based therapy. Multiple regression analyses determined that patients' baseline characteristics also had a significant effect on survival. When adjusted for performance status and other baseline prognostic factors, survival among patients treated with irinotecan remained significantly longer than in the control populations (p=0.001 for Study 7 and p=0.017 for Study 8). Measurements of pain, performance status, and weight loss were collected prospectively in the two studies; however, the plan for the analysis of these data was defined retrospectively. When comparing irinotecan with best supportive care in Study 7, this analysis showed a statistically significant advantage for irinotecan, with longer time to development of pain (6.9 months versus 2.0 months), time to performance status deterioration (5.7 months versus 3.3 months), and time to > 5% weight loss (6.4 months versus 4.2 months). Additionally, 33.3% (33/99) of patients with a baseline performance status of 1 or 2 showed an improvement in performance status when treated with irinotecan versus 11.3% (7/62) of patients receiving best supportive care (p=0.002). Because of the inclusion of patients with non-measurable disease, intent-to-treat response rates could not be assessed.
| Figure 3. Survival Second-Line Irinotecan vs Best Supportive Care (BSC) Study 7 |
|---|
 |
| Figure 4. Survival Second-Line Irinotecan vs Infusion 5-FU Study 8 |
|---|
 |
| Study 7 | Study 8 | |||
|---|---|---|---|---|
| Irinotecan | BSC* | Irinotecan | 5-FU | |
| Number of patients | 189 | 90 | 127 | 129 |
| Demographics and treatment administration | ||||
| Female/Male (%) | 32/68 | 42/58 | 43/57 | 35/65 |
| Median age in years (range) | 59 (22–75) | 62 (34–75) | 58 (30–75) | 58 (25–75) |
| Performance status (%) | ||||
| 0 | 47 | 31 | 58 | 54 |
| 1 | 39 | 46 | 35 | 43 |
| 2 | 14 | 23 | 8 | 3 |
| Primary tumor (%) | ||||
| Colon | 55 | 52 | 57 | 62 |
| Rectum | 45 | 48 | 43 | 38 |
| Prior 5-FU therapy (%) | ||||
| For metastatic disease | 70 | 63 | 58 | 68 |
| As adjuvant treatment | 30 | 37 | 42 | 32 |
| Prior irradiation (%) | 26 | 27 | 18 | 20 |
| Duration of study treatment (median, months) (Log-rank test) | 4.1 | -- | 4.2 (p=0.02) | 2.8 |
| Relative dose intensity (median %)† | 94 | -- | 95 | 81–99 |
| Survival | ||||
| Survival (median, months) | 9.2 | 6.5 | 10.8 | 8.5 |
| (Log-rank test) | (p=0.0001) | (p=0.035) | ||
In the two randomized studies, the EORTC QLQ-C30 instrument was utilized. At the start of each cycle of therapy, patients completed a questionnaire consisting of 30 questions, such as "Did pain interfere with daily activities?" (1 = Not at All, to 4 = Very Much) and "Do you have any trouble taking a long walk?" (Yes or No). The answers from the 30 questions were converted into 15 subscales, that were scored from 0 to 100, and the global health status subscale that was derived from two questions about the patient's sense of general well being in the past week. The results as summarized in Table 13 are based on patients' worst post-baseline scores. In Study 7, a multivariate analysis and univariate analyses of the individual subscales were performed and corrected for multivariate testing. Patients receiving irinotecan reported significantly better results for the global health status, on two of five functional subscales, and on four of nine symptom subscales. As expected, patients receiving irinotecan noted significantly more diarrhea than those receiving best supportive care. In Study 8, the multivariate analysis on all 15 subscales did not indicate a statistically significant difference between irinotecan and infusional 5-FU.
| QLQ-C30 Subscale | Study 7 | Study 8 | ||||
|---|---|---|---|---|---|---|
| Irinotecan | BSC | p-value | Irinotecan | 5-FU | p-value | |
| ||||||
| Global health status | 47 | 37 | 0.03 | 53 | 52 | 0.9 |
| Functional scales | ||||||
| Cognitive | 77 | 68 | 0.07 | 79 | 83 | 0.9 |
| Emotional | 68 | 64 | 0.4 | 64 | 68 | 0.9 |
| Social | 58 | 47 | 0.06 | 65 | 67 | 0.9 |
| Physical | 60 | 40 | 0.0003 | 66 | 66 | 0.9 |
| Role | 53 | 35 | 0.02 | 54 | 57 | 0.9 |
| Symptom Scales | ||||||
| Fatigue | 51 | 63 | 0.03 | 47 | 46 | 0.9 |
| Appetite loss | 37 | 57 | 0.0007 | 35 | 38 | 0.9 |
| Pain assessment | 41 | 56 | 0.009 | 38 | 34 | 0.9 |
| Insomnia | 39 | 47 | 0.3 | 39 | 33 | 0.9 |
| Constipation | 28 | 41 | 0.03 | 25 | 19 | 0.9 |
| Dyspnea | 31 | 40 | 0.2 | 25 | 24 | 0.9 |
| Nausea/Vomiting | 27 | 29 | 0.5 | 25 | 16 | 0.09 |
| Financial impact | 22 | 26 | 0.5 | 24 | 15 | 0.3 |
| Diarrhea | 32 | 19 | 0.01 | 32 | 22 | 0.2 |
Find CAMPTOSAR® medical information:
Find CAMPTOSAR® medical information:
CAMPTOSAR® Quick Finder
Health Professional Information
Clinical Studies
14 CLINICAL STUDIES
Irinotecan has been studied in clinical trials in combination with 5-fluorouracil (5-FU) and leucovorin (LV) and as a single agent [see Dosage and Administration (2)]. When given as a component of combination-agent treatment, irinotecan was either given with a weekly schedule of bolus 5-FU/LV or with an every-2-week schedule of infusional 5-FU/LV. Weekly and once-every-3-week dosage schedules were used for the single-agent irinotecan studies. Clinical studies of combination and single-agent use are described below.
14.1 Metastatic Colorectal Cancer
First-Line Therapy in Combination with 5-FU/LV: Studies 1 and 2
Two phase 3, randomized, controlled, multinational clinical trials support the use of CAMPTOSAR Injection as first-line treatment of patients with metastatic carcinoma of the colon or rectum. In each study, combinations of irinotecan with 5-FU and LV were compared with 5-FU and LV alone. Study 1 compared combination irinotecan/bolus 5-FU/LV therapy given weekly with a standard bolus regimen of 5-FU/LV alone given daily for 5 days every 4 weeks; an irinotecan-alone treatment arm given on a weekly schedule was also included. Study 2 evaluated two different methods of administering infusional 5-FU/LV, with or without irinotecan. In both studies, concomitant medications such as antiemetics, atropine, and loperamide were given to patients for prophylaxis and/or management of symptoms from treatment. In Study 2, a 7-day course of fluoroquinolone antibiotic prophylaxis was given in patients whose diarrhea persisted for greater than 24 hours despite loperamide or if they developed a fever in addition to diarrhea. Treatment with oral fluoroquinolone was also initiated in patients who developed an absolute neutrophil count (ANC) <500/mm3, even in the absence of fever or diarrhea. Patients in both studies also received treatment with intravenous antibiotics if they had persistent diarrhea or fever or if ileus developed.
In both studies, the combination of irinotecan/5-FU/LV therapy resulted in significant improvements in objective tumor response rates, time to tumor progression, and survival when compared with 5-FU/LV alone. These differences in survival were observed in spite of second-line therapy in a majority of patients on both arms, including crossover to irinotecan-containing regimens in the control arm. Patient characteristics and major efficacy results are shown in Table 10.
| Study 1 | Study 2 | ||||
|---|---|---|---|---|---|
| Irinotecan + Bolus 5-FU/LV weekly × 4 every 6 weeks | Bolus 5-FU/LV daily × 5 every 4 weeks | Irinotecan weekly × 4 every 6 weeks | Irinotecan + Infusional 5-FU/LV | Infusional 5-FU/LV | |
| Number of patients | 231 | 226 | 226 | 198 | 187 |
| Demographics and treatment administration | |||||
| Female/Male (%) | 34/65 | 45/54 | 35/64 | 33/67 | 47/53 |
| Median age in years (range) | 62 (25–85) | 61 (19–85) | 61 (30–87) | 62 (27–75) | 59 (24–75) |
| Performance status (%) | |||||
| 0 | 39 | 41 | 46 | 51 | 51 |
| 1 | 46 | 45 | 46 | 42 | 41 |
| 2 | 15 | 13 | 8 | 7 | 8 |
| Primary tumor (%) | |||||
| Colon | 81 | 85 | 84 | 55 | 65 |
| Rectum | 17 | 14 | 15 | 45 | 35 |
| Median time from diagnosis to randomization (months, range) | 1.9 (0–161) | 1.7 (0–203) | 1.8 (0.1–185) | 4.5 (0–88) | 2.7 (0–104) |
| Prior adjuvant 5-FU therapy (%) No Yes | 89 11 | 92 8 | 90 10 | 74 26 | 76 24 |
| Median duration of study treatment* (months) | 5.5 | 4.1 | 3.9 | 5.6 | 4.5 |
| Median Relative Dose Intensity (%)* Irinotecan 5-FU | 72 71 | — 86 | 75 — | 87 86 | — 93 |
| Efficacy Results | |||||
| Confirmed objective tumor response rate† (%) | 39 | 21 | 18 | 35 | 22 |
| (p<0.0001)‡ | (p<0.005)‡ | ||||
| Median time to tumor progression§ (months) | 7.0 | 4.3 | 4.2 | 6.7 | 4.4 |
| (p=0.004)§ | (p<0.001)§ | ||||
| Median survival (months) | 14.8 | 12.6 | 12.0 | 17.4 | 14.1 |
| (p<0.05)§ | (p<0.05)§ | ||||
Improvement was noted with irinotecan-based combination therapy relative to 5-FU/LV when response rates and time to tumor progression were examined across the following demographic and disease-related subgroups (age, gender, ethnic origin, performance status, extent of organ involvement with cancer, time from diagnosis of cancer, prior adjuvant therapy, and baseline laboratory abnormalities). Figures 1 and 2 illustrate the Kaplan-Meier survival curves for the comparison of irinotecan/5-FU/LV versus 5-FU/LV in Studies 1 and 2, respectively.
Second-Line Therapy After 5-FU-Based Treatment
4 Weekly Doses on a 6-Week Cycle: Studies 3, 4, and 5
Data from three open-label, single-agent, clinical studies, involving a total of 304 patients in 59 centers, support the use of CAMPTOSAR in the treatment of patients with metastatic cancer of the colon or rectum that has recurred or progressed following treatment with 5-FU-based therapy. These studies were designed to evaluate tumor response rate and do not provide information on effects on survival and disease-related symptoms. In each study, CAMPTOSAR was administered in repeated 6-week cycles consisting of a 90-minute intravenous infusion once weekly for 4 weeks, followed by a 2-week rest period. Starting doses of CAMPTOSAR in these trials were 100, 125, or 150 mg/m2, but the 150-mg/m2 dose was poorly tolerated (due to high rates of grade 4 late diarrhea and febrile neutropenia). Study 3 enrolled 48 patients and was conducted by a single investigator at several regional hospitals. Study 4 was a multicenter study conducted by the North Central Cancer Treatment Group. All 90 patients enrolled in Study 4 received a starting dose of 125 mg/m2. Study 5 was a multicenter study that enrolled 166 patients from 30 institutions. The initial dose in Study 5 was 125 mg/m2 but was reduced to 100 mg/m2 because the toxicity seen at the 125-mg/m2 dose was perceived to be greater than that seen in previous studies. All patients in these studies had metastatic colorectal cancer, and the majority had disease that recurred or progressed following a 5-FU-based regimen administered for metastatic disease. The results of the individual studies are shown in Table 11.
| Study | ||||
|---|---|---|---|---|
| 3 | 4 | 5 | ||
| ||||
| Number of Patients | 48 | 90 | 64 | 102 |
| Starting Dose (mg/m2/week × 4) | 125* | 125 | 125 | 100 |
| Demographics and Treatment Administration | ||||
| Female/Male (%) | 46/54 | 36/64 | 50/50 | 51/49 |
| Median Age in years (range) | 63 (29–78) | 63 (32–81) | 61 (42–84) | 64 (25–84) |
| Ethnic Origin (%) | ||||
| White | 79 | 96 | 81 | 91 |
| African American | 12 | 4 | 11 | 5 |
| Hispanic | 8 | 0 | 8 | 2 |
| Oriental/Asian | 0 | 0 | 0 | 2 |
| Performance Status (%) | ||||
| 0 | 60 | 38 | 59 | 44 |
| 1 | 38 | 48 | 33 | 51 |
| 2 | 2 | 14 | 8 | 5 |
| Primary Tumor (%) | ||||
| Colon | 100 | 71 | 89 | 87 |
| Rectum | 0 | 29 | 11 | 8 |
| Unknown | 0 | 0 | 0 | 5 |
| Prior 5-FU Therapy (%) | ||||
| For Metastatic Disease | 81 | 66 | 73 | 68 |
| ≤ 6 months after Adjuvant | 15 | 7 | 27 | 28 |
| > 6 months after Adjuvant | 2 | 16 | 0 | 2 |
| Classification Unknown | 2 | 12 | 0 | 3 |
| Prior Pelvic/Abdominal Irradiation (%) | ||||
| Yes | 3 | 29 | 0 | 0 |
| Other | 0 | 9 | 2 | 4 |
| None | 97 | 62 | 98 | 96 |
| Duration of Treatment with CAMPTOSAR (median, months) | 5 | 4 | 4 | 3 |
| Relative Dose Intensity† (median %) | 74 | 67 | 73 | 81 |
| Efficacy | ||||
| Confirmed Objective Response Rate (%)‡ (95% CI) | 21 (9.3 – 32.3) | 13 (6.3 – 20.4) | 14 (5.5 – 22.6) | 9 (3.3 – 14.3) |
| Time to Response (median, months) | 2.6 | 1.5 | 2.8 | 2.8 |
| Response Duration (median, months) | 6.4 | 5.9 | 5.6 | 6.4 |
| Survival (median, months) | 10.4 | 8.1 | 10.7 | 9.3 |
| 1-Year Survival (%) | 46 | 31 | 45 | 43 |
In the intent-to-treat analysis of the pooled data across all three studies, 193 of the 304 patients began therapy at the recommended starting dose of 125 mg/m2. Among these 193 patients, 2 complete and 27 partial responses were observed, for an overall response rate of 15.0% (95% Confidence Interval [CI], 10.0% to 20.1%) at this starting dose. A considerably lower response rate was seen with a starting dose of 100 mg/m2. The majority of responses were observed within the first two cycles of therapy, but responses did occur in later cycles of treatment (one response was observed after the eighth cycle). The median response duration for patients beginning therapy at 125 mg/m2 was 5.8 months (range, 2.6 to 15.1 months). Of the 304 patients treated in the three studies, response rates to CAMPTOSAR were similar in males and females and among patients older and younger than 65 years. Rates were also similar in patients with cancer of the colon or cancer of the rectum and in patients with single and multiple metastatic sites. The response rate was 18.5% in patients with a performance status of 0 and 8.2% in patients with a performance status of 1 or 2. Patients with a performance status of 3 or 4 have not been studied. Over half of the patients responding to CAMPTOSAR had not responded to prior 5-FU. Patients who had received previous irradiation to the pelvis responded to CAMPTOSAR at approximately the same rate as those who had not previously received irradiation.
Once-Every-3-Week Dosage Schedule
Single Arm Study: Study 6
Data from an open-label, single-agent, single-arm, multicenter, clinical study involving a total of 132 patients support a once every-3-week dosage schedule of irinotecan in the treatment of patients with metastatic cancer of the colon or rectum that recurred or progressed following treatment with 5-FU. Patients received a starting dose of 350 mg/m2 given by 30-minute intravenous infusion once every 3 weeks. Among the 132 previously treated patients in this trial, the intent-to-treat response rate was 12.1% (95% CI, 7.0% to 18.1%).
Randomized Studies: Studies 7 and 8
Two multicenter, randomized, clinical studies further support the use of irinotecan given by the once-every-3-week dosage schedule in patients with metastatic colorectal cancer whose disease has recurred or progressed following prior 5-FU therapy. In Study 7, second-line irinotecan therapy plus best supportive care was compared with best supportive care alone. In Study 8, second-line irinotecan therapy was compared with infusional 5-FU-based therapy. In both studies, irinotecan was administered intravenously at a starting dose of 350 mg/m2 over 90 minutes once every 3 weeks. The starting dose was 300 mg/m2 for patients who were 70 years and older or who had a performance status of 2. The highest total dose permitted was 700 mg. Dose reductions and/or administration delays were permitted in the event of severe hematologic and/or nonhematologic toxicities while on treatment. Best supportive care was provided to patients in both arms of Study 7 and included antibiotics, analgesics, corticosteroids, transfusions, psychotherapy, or any other symptomatic therapy as clinically indicated. In both studies, concomitant medications such as antiemetics, atropine, and loperamide were given to patients for prophylaxis and/or management of symptoms from treatment. If late diarrhea persisted for greater than 24 hours despite loperamide, a 7-day course of fluoroquinolone antibiotic prophylaxis was given. Patients in the control arm of the Study 8 received one of the following 5-FU regimens: (1) LV, 200 mg/m2 IV over 2 hours; followed by 5-FU, 400 mg/m2 IV bolus; followed by 5-FU, 600 mg/m2 continuous IV infusion over 22 hours on days 1 and 2 every 2 weeks; (2) 5-FU, 250 to 300 mg/m2/day protracted continuous IV infusion until toxicity; (3) 5-FU, 2.6 to 3 g/m2 IV over 24 hours every week for 6 weeks with or without LV, 20 to 500 mg/m2/day every week IV for 6 weeks with 2-week rest between cycles. Patients were to be followed every 3 to 6 weeks for 1 year.
A total of 535 patients were randomized in the two studies at 94 centers. The primary endpoint in both studies was survival. The studies demonstrated a significant overall survival advantage for irinotecan compared with best supportive care (p=0.0001) and infusional 5-FU-based therapy (p=0.035) as shown in Figures 3 and 4. In Study 7, median survival for patients treated with irinotecan was 9.2 months compared with 6.5 months for patients receiving best supportive care. In Study 8, median survival for patients treated with irinotecan was 10.8 months compared with 8.5 months for patients receiving infusional 5-FU-based therapy. Multiple regression analyses determined that patients' baseline characteristics also had a significant effect on survival. When adjusted for performance status and other baseline prognostic factors, survival among patients treated with irinotecan remained significantly longer than in the control populations (p=0.001 for Study 7 and p=0.017 for Study 8). Measurements of pain, performance status, and weight loss were collected prospectively in the two studies; however, the plan for the analysis of these data was defined retrospectively. When comparing irinotecan with best supportive care in Study 7, this analysis showed a statistically significant advantage for irinotecan, with longer time to development of pain (6.9 months versus 2.0 months), time to performance status deterioration (5.7 months versus 3.3 months), and time to > 5% weight loss (6.4 months versus 4.2 months). Additionally, 33.3% (33/99) of patients with a baseline performance status of 1 or 2 showed an improvement in performance status when treated with irinotecan versus 11.3% (7/62) of patients receiving best supportive care (p=0.002). Because of the inclusion of patients with non-measurable disease, intent-to-treat response rates could not be assessed.
| Figure 3. Survival Second-Line Irinotecan vs Best Supportive Care (BSC) Study 7 |
|---|
|
| Figure 4. Survival Second-Line Irinotecan vs Infusion 5-FU Study 8 |
|---|
|
| Study 7 | Study 8 | |||
|---|---|---|---|---|
| Irinotecan | BSC* | Irinotecan | 5-FU | |
| Number of patients | 189 | 90 | 127 | 129 |
| Demographics and treatment administration | ||||
| Female/Male (%) | 32/68 | 42/58 | 43/57 | 35/65 |
| Median age in years (range) | 59 (22–75) | 62 (34–75) | 58 (30–75) | 58 (25–75) |
| Performance status (%) | ||||
| 0 | 47 | 31 | 58 | 54 |
| 1 | 39 | 46 | 35 | 43 |
| 2 | 14 | 23 | 8 | 3 |
| Primary tumor (%) | ||||
| Colon | 55 | 52 | 57 | 62 |
| Rectum | 45 | 48 | 43 | 38 |
| Prior 5-FU therapy (%) | ||||
| For metastatic disease | 70 | 63 | 58 | 68 |
| As adjuvant treatment | 30 | 37 | 42 | 32 |
| Prior irradiation (%) | 26 | 27 | 18 | 20 |
| Duration of study treatment (median, months) (Log-rank test) | 4.1 | -- | 4.2 (p=0.02) | 2.8 |
| Relative dose intensity (median %)† | 94 | -- | 95 | 81–99 |
| Survival | ||||
| Survival (median, months) | 9.2 | 6.5 | 10.8 | 8.5 |
| (Log-rank test) | (p=0.0001) | (p=0.035) | ||
In the two randomized studies, the EORTC QLQ-C30 instrument was utilized. At the start of each cycle of therapy, patients completed a questionnaire consisting of 30 questions, such as "Did pain interfere with daily activities?" (1 = Not at All, to 4 = Very Much) and "Do you have any trouble taking a long walk?" (Yes or No). The answers from the 30 questions were converted into 15 subscales, that were scored from 0 to 100, and the global health status subscale that was derived from two questions about the patient's sense of general well being in the past week. The results as summarized in Table 13 are based on patients' worst post-baseline scores. In Study 7, a multivariate analysis and univariate analyses of the individual subscales were performed and corrected for multivariate testing. Patients receiving irinotecan reported significantly better results for the global health status, on two of five functional subscales, and on four of nine symptom subscales. As expected, patients receiving irinotecan noted significantly more diarrhea than those receiving best supportive care. In Study 8, the multivariate analysis on all 15 subscales did not indicate a statistically significant difference between irinotecan and infusional 5-FU.
| QLQ-C30 Subscale | Study 7 | Study 8 | ||||
|---|---|---|---|---|---|---|
| Irinotecan | BSC | p-value | Irinotecan | 5-FU | p-value | |
| ||||||
| Global health status | 47 | 37 | 0.03 | 53 | 52 | 0.9 |
| Functional scales | ||||||
| Cognitive | 77 | 68 | 0.07 | 79 | 83 | 0.9 |
| Emotional | 68 | 64 | 0.4 | 64 | 68 | 0.9 |
| Social | 58 | 47 | 0.06 | 65 | 67 | 0.9 |
| Physical | 60 | 40 | 0.0003 | 66 | 66 | 0.9 |
| Role | 53 | 35 | 0.02 | 54 | 57 | 0.9 |
| Symptom Scales | ||||||
| Fatigue | 51 | 63 | 0.03 | 47 | 46 | 0.9 |
| Appetite loss | 37 | 57 | 0.0007 | 35 | 38 | 0.9 |
| Pain assessment | 41 | 56 | 0.009 | 38 | 34 | 0.9 |
| Insomnia | 39 | 47 | 0.3 | 39 | 33 | 0.9 |
| Constipation | 28 | 41 | 0.03 | 25 | 19 | 0.9 |
| Dyspnea | 31 | 40 | 0.2 | 25 | 24 | 0.9 |
| Nausea/Vomiting | 27 | 29 | 0.5 | 25 | 16 | 0.09 |
| Financial impact | 22 | 26 | 0.5 | 24 | 15 | 0.3 |
| Diarrhea | 32 | 19 | 0.01 | 32 | 22 | 0.2 |
Health Professional Information
{{section_name_patient}}
{{section_body_html_patient}}
Resources
Didn’t find what you were looking for? Contact us.
Chat online with Pfizer Medical Information regarding your inquiry on a Pfizer medicine.
*Speak with a Pfizer Medical Information Professional regarding your medical inquiry. Available 9AM-5Pm ET Monday to Friday; excluding holidays.
Submit a medical question for Pfizer prescription products.
Report Adverse Event
To report an adverse event related to the Pfizer-BioNTech COVID-19 Vaccine, and you are not part of a clinical trial* for this product, click the link below to submit your information:
Pfizer Safety Reporting Site*If you are involved in a clinical trial for this product, adverse events should be reported to your coordinating study site.
If you cannot use the above website, or would like to report an adverse event related to a different Pfizer product, please call Pfizer Safety at (800) 438-1985.
You may also contact the U.S. Food and Drug Administration (FDA) directly to report adverse events or product quality concerns either online at www.fda.gov/medwatch or call (800) 822-7967.